Science in the ROC and the Pacific Rim, 1981-1992:
A Citationist PerspectiveEugene Garfield
Founder and Chairman
Institute for Scientific Information
Philadelphia, PA 19106 USA
215-386-0100; (fax) 215-387-1266; (e mail)National Science Council
Science and Technology Information Center
Third Conference of Scientific Editors of the ROC
Taipei, ROC
17 March 1993
Good morning. It's an honor to participate in this conference and I thank Dr. Tao-Hsing Ma for inviting me to return to the Republic of China. In 1990, I came to Taipei at his request to discuss how ISIR selects journals for coverage in Current Contents Science Citation Index SCI and its other databases.
On this visit, Dr. Ma suggested another important and interesting topic. That is, how ISI's data are increasingly being used as tools for evaluating research scholarship.
As you know, the Institute for Scientific Information is one of the world's leading secondary information services. Its major products -- the SCI and CC are no doubt familiar to you. They were primarily designed to help researchers, librarians, and other information specialists to discover and recover papers relevant to their interests.
Of course, as information specialists, many of you have probably used ISI's data for other purposes than information awareness or retrieval. Our annual Journal Citation Reports (JCR) have been used by librarians, editors, and others for quantitative data on the largest, most cited, and highest impact journals of international scholarship. These data have been used to manage journal collections, compare the relative rankings of particular titles, and so on.
In addition, ISI's comprehensive databases are being used by research analysts, policy makers, and granting agencies for a new purpose. That is, to compare the research performance of nations, institutions, departments, and individuals in terms of publication output and impact. Indeed, ISI's databases have given rise to a new field of research called "scientometrics".
In this presentation, we will take a citationist perspective on science in the ROC and other Pacific Rim nations. To provide a current perspective, we'll examine most recent 12-year period, from 1981 through 1992. To start, we'll examine the number of papers in all fields of science produced by authors based in the ROC and the Pacific Rim. We'll also examine number of citations received and, most important of all, the average number of citations per paper (impact).
Also, impact comparisons will be made in five major research areas -- agriculture & biology, life sciences, clinical medicine, physical & chemical sciences, and engineering & technology. We will then conclude by identifying the most-cited ROC papers, institutions, and authors.
Before we begin, let me stress that this analysis is not an exhaustive inventory of every paper produced by ROC authors. Rather, it includes that portion which is published in the journals indexed by ISI. As it turns out, ISI's data consistently show that a relatively small set of journals accounts for the majority of both papers and citations. This is shown in the following viewgraph.
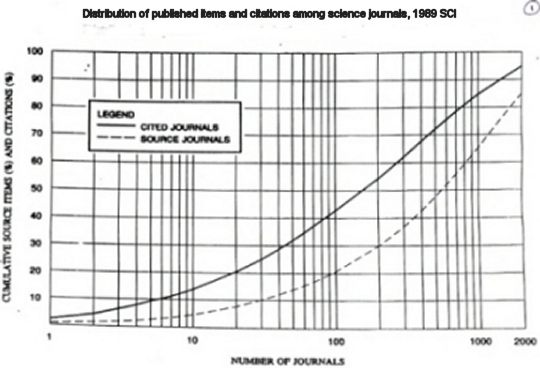
VIEWGRAPH 1: SOURCE/CITATION DISTRIBUTION BY JOURNAL, 1989 JCRThe data shown here are based on about 4,500 journals that were covered in the 1989 The dashed line shows that just 100 journals account for more than 20 percent of what is published. Just as interesting, the solid line shows that 100 journals account for more than 40 percent of what is cited.
Only 600 journals account for more than half of what is published--and over 75 percent of what is cited. Keep in mind that the source and cited journals are not necessarily one and the same. Thus, by indexing over 7,000 journals, ISI is indeed covering more than the most significant journals of international research.
Let's now begin our citation survey by defining what we mean by Pacific Rim nations.
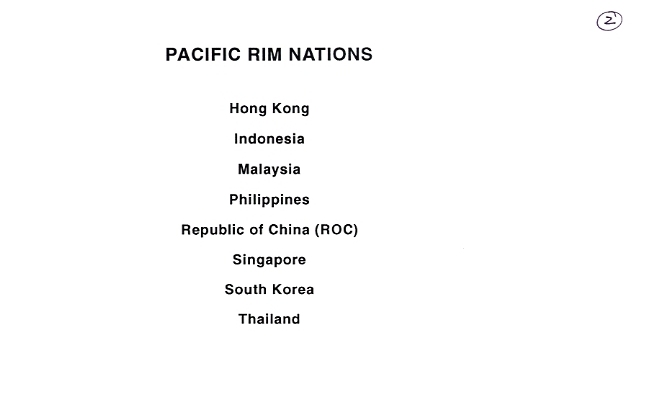
VIEWGRAPH 2: PACIFIC RIM NATIONSThis study includes data on the 8 Pacific Rim nations shown here--Hong Kong, Indonesia, Malaysia, the Philippines, the Republic of China (ROC), Singapore, South Korea, and Thailand. They were selected because they are comparable in terms of the numbers of ISI-indexed papers from 1981-1992. Also, they are comparable in terms of the size of their economies and scientific communities.
Two nations are perhaps conspicuous in their absence. The People's Republic of China was not included because of its size-- the number of its papers equaled that of all 8 nations shown here combined -- more than 60,000 over a 12-year period. However, we did calculate the number of citations (103,721) and the overall impact (1.7).
For the same reasons, Japan was excluded from this analysis. Japan ranks among the world's superpowers in research, both in terms of its publication output and impact. In effect, comparing the Pacific Rim nations with Japan would be like comparing them to the US, Europe, and other research superpowers. This will be shown in a later viewgraph.
The data on Pacific Rim science is taken from ISI's Science Indicators Database. With it, we can track the number of papers and the citations they received in successive and overlapping multi-year periods. In this case, we used a five-year "window". By aggregating papers and citations over five-year periods, we avoid the sometimes wide fluctuations that may occur on an annual basis.
Let's now examine the number of papers from the Pacific Rim nations that were indexed in ISI's databases.
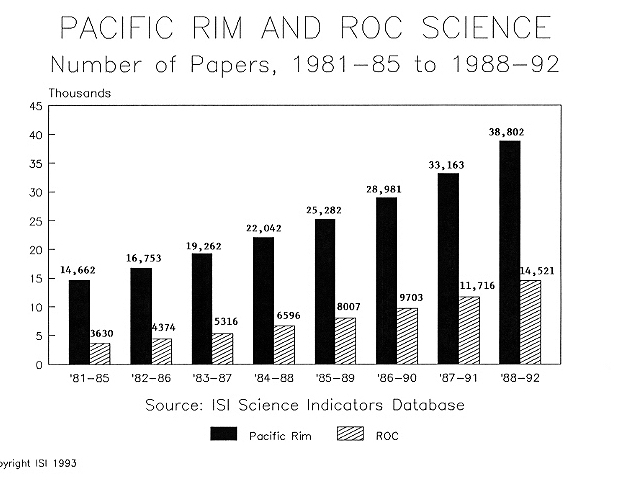
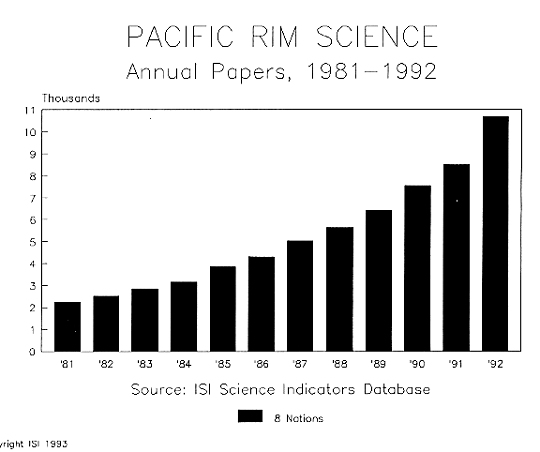
VIEWGRAPH 3: PACIFIC RIM AND ROC PAPERS, 1981-1992
In this graph, the numbers of papers from all 8 Pacific Rim nations combined are shown in the solid bars and those from the ROC are shown in the shaded bars. Pacific Rim papers increased from about 14,700 in the period 1981-1985 to more than 38,800 in
1988-92. This represents a growth of 165 percent, compared to a growth of 47 percent for the SCI. This trend is not the result of the increase in the size of the ISI file. Rather, it reflects the increased rate of output of Pacific Rim author publication in international journals.
The number of ROC papers increased from about 3,600 in 1981-1985 to more than 14,500 in 1988-1992 ... a 300 percent growth, almost double that for all Pacific Rim nations and six times that of the entire SCI file.
The following viewgraph shows the proportion of Pacific Rim papers accounted for by each nation.
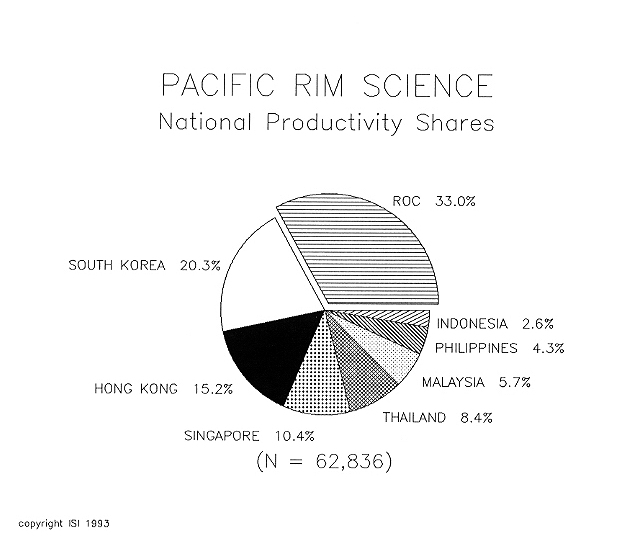
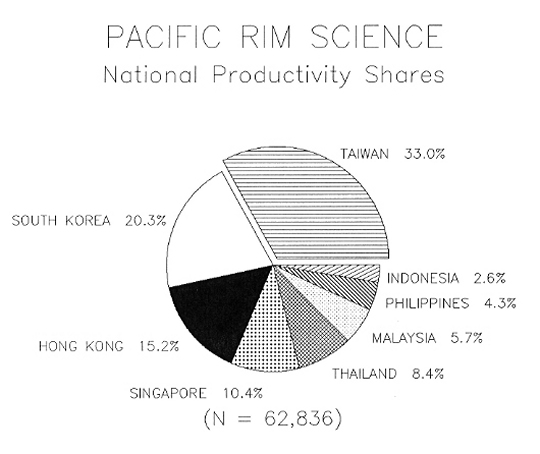
VIEWGRAPH 4: ROC vs PACIFIC RIM PAPERS, 1981-1992
Over the 12-year period 1981-1992 the indexed more than 62,800 Pacific Rim papers. The ROC accounted for the largest share--33 percent. South Korea followed with 20 percent, Hong Kong with 15 percent, and Singapore 10 percent. The remaining nations each produced less than 10 percent--Thailand (8%), Malaysia (6%), the Philippines (4%), and Indonesia (3%).
The following viewgraph shows the number of citations to ROC and Pacific Rim papers.
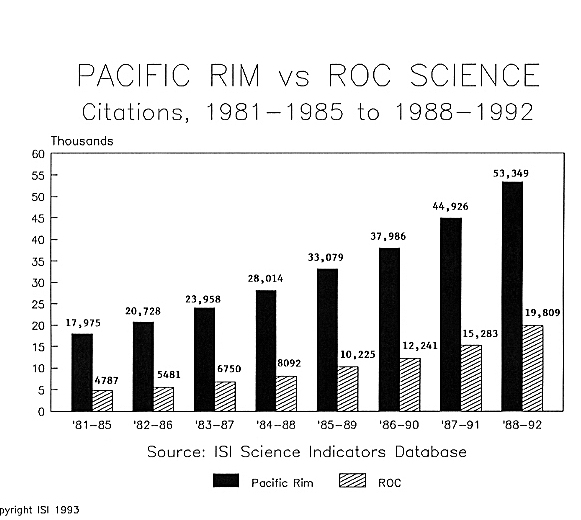
VIEWGRAPH 5: CITATIONS TO PAC. RIM PAPERS, 1981-85 VS 1988-92Citations to all Pacific Rim nations' papers, shown in the solid bars, increased from about 18,000 in 1981-1985 to more than 53,300 in 1988-1992, a growth of almost 200 percent. This compares to a growth of 74 percent for the SCI. The ROC's citations, shown in the shaded bars, grew by more than 300 percent, from about 4,800 in 1981-1985 to 19,800 in 1988-1992..
Citations are more meaningful when compared to the numbers of papers. That is, we can calculate the average number of citations per paper -- the "impact factor". In fact, there are two ways to calculate impact. For example, citations can be divided by papers to arrive at an overall impact factor. Alternately, citations can be divided the number of papers actually cited--that is, uncited papers are excluded. This results in the so-called "cited impact factor".
The following viewgraph shows both the overall and cited impact factors for ROC research from 1981-85 through 1988-92.
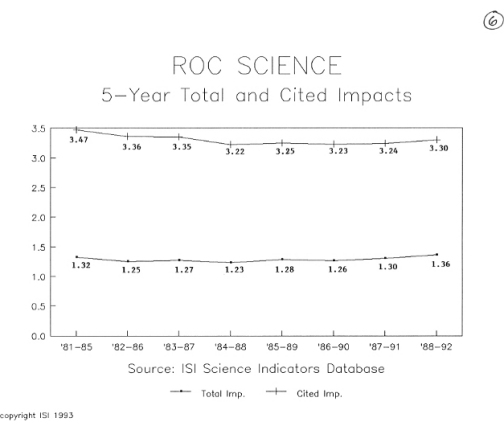
VIEWGRAPH 6: TOTAL Vs CITED IMPACT OF ROC RESEARCH
The top line shows the trend in cited impact for ROC papers while the bottom line shows trends in total impact.
Both trend lines are fairly stable. The ROC's cited impact factor was 3.47 at the beginning of the time period and 3.30 at the end--a decline of just 5 percent. In terms of total impact, the ROC started at 1.32 and ended at 1.36, a slight increase of 3 percent.
An interesting question is how the ROC's impact factors compare with that of other nations. One basis for comparison is the entire file and all the nations it represents. This "world average" is arbitrarily set at a value of 1.0. Thus, if the ROC's impact is greater than the world average it will have a value higher than 1.0. Conversely, if it is lower than the world average, the ROC's impact will be less than 1.0.
This is shown in the following viewgraph.
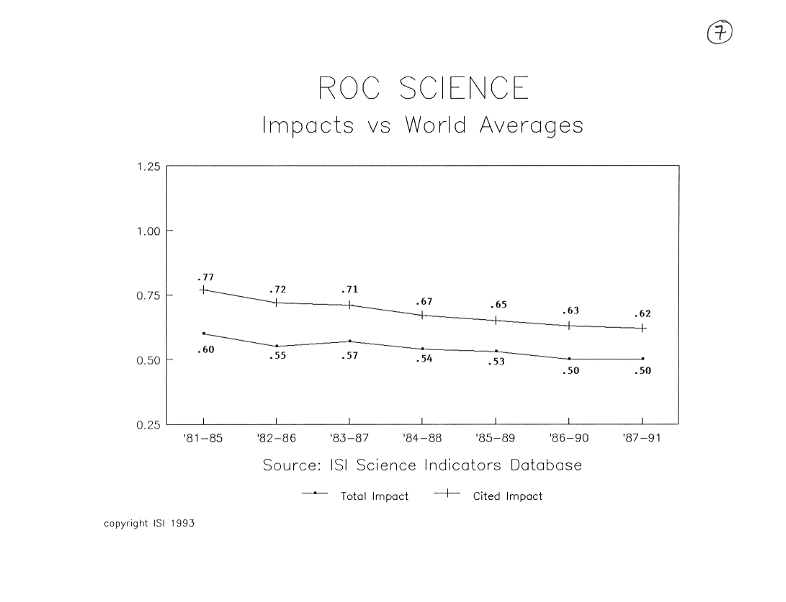
VIEWGRAPH 7: ROC IMPACTS vs WORLD BASELINE, 81-85 TO 88-92
This graph shows that both the ROC's total and cited impacts are below that of the world average. The top trend line shows the ROC's cited impact. At the beginning of the period it was 23 percent below the world average -- that is, the average ROC paper was cited 23 percent less often than the average paper. At the end, the ROC's cited impact was 38 percent less than the world average. Similarly, in terms of total impact, the ROC started the period at 40 percent below the world average and ended at 50 percent below.
The SCI world averages are dominated by the leading research superpowers, such as the US, Europe, Japan, Canada, Australia, and so on. These nations have substantially greater scientific resources than the ROC in absolute terms--more funding, higher numbers of researchers, a larger population of graduate students from around the world, including the ROC, and so on.
It may be more appropriate to compare the performance of the ROC with other nations of similar size and resources. As noted earlier, seven other Pacific Rim nations were selected to serve as a regional basis for comparison. Granted, there are many differences between Pacific Rim nations -- but they are more comparable to themselves than to the dominant research superpowers.
Before we present data on the Pacific Rim, let's first see how the ROC and People's Republic of China compare in terms of impact.
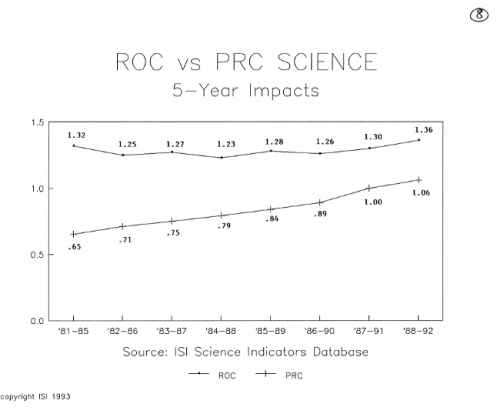
VIEWGRAPH 8: ROC vs PRC IMPACT IMPACT, 1981-85 TO 1988-92The top line shows 5-year impact factors for the ROC, reviewed previously, and the bottom shows impact trends for the PRC. As mentioned earlier, the ROC has remained fairly steady, beginning with an impact of 1.32 and ending at 1.36, a modest growth of 3 percent. The PRC showed steady gains in impact, increasing from .65 at the beginning to 1.06 at the end of the period, a growth of 63 percent.
Let's now see how they compare on cited impact.
VIEWGRAPH 9: ROC vs PRC CITED IMPACT, 1981-85 TO 1988-92
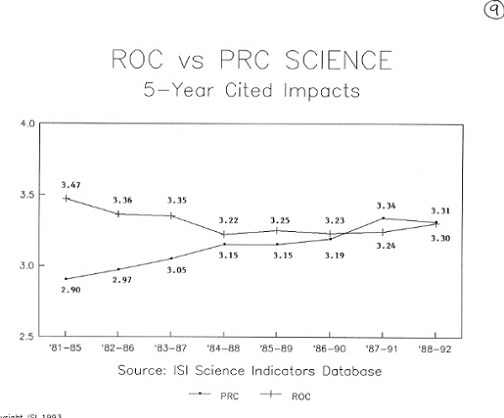
The top line shows cited impact trends for the ROC and the bottom represents PRC cited impacts. As noted previously, the ROC steadily declined, from a cited impact of 3.47 at the beginning to 3.30 at the end, a 5 percent decline. The PRC showed steady gains in cited impact, increasing from 2.90 to 3.31, a growth of 14 percent. Thus, the PRC and ROC were virtually equal in cited impact in the most recent period, 1988-
1992.
Let's return now to our comparisons of the ROC and the Pacific Rim nations. The following discussion presents 5-year cited impact trends for the leading Pacific Rim nations in all science fields as well as in five specific fields. By "leading" nation, we mean those accounting for at least 10 percent of total regional papers.
Before we begin, let's see how ROC science was distributed by major fields over the entire period, 1981-1992.
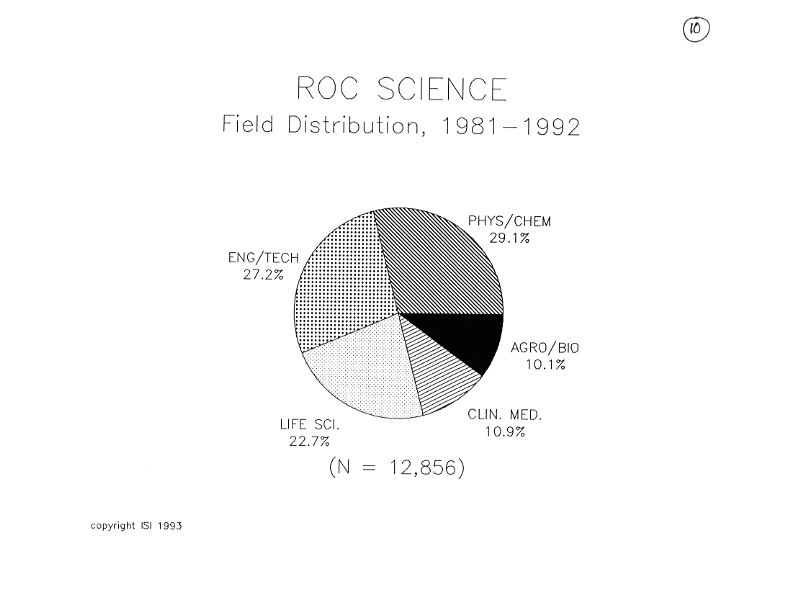
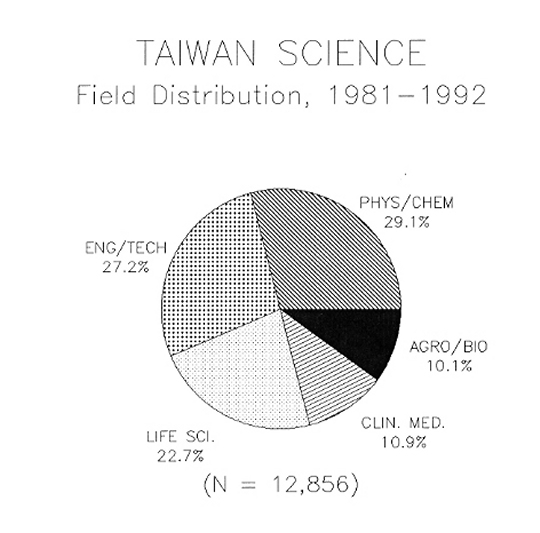
VIEWGRAPH 10: DIST. OF ROC SCIENCE BY FIELD, 1981-92The physical and chemical sciences accounted for 29 percent of the ROC's 12,856 ISI-indexed papers from 1981-1992. This includes the earth sciences and mathematics.
Engineering and technology is a close second with 27 percent of ROC papers. This includes virtually all engineering specialties from aerospace to nuclear as well as materials science, optics and acoustics, and mining.
The life sciences account for 23 percent, and include molecular biology, genetics, biochemistry, biophysics, microbiology, cell biology, and so on.
Clinical medicine and agricultural/biological sciences take up the smallest shares-- 11 and 10 percent each. Clinical medicine includes virtually all medical specialties, from anesthesiology to urology. The agricultural and biological sciences include agriculture, agronomy, biotechnology, plant sciences, and aquatic and environmental science.
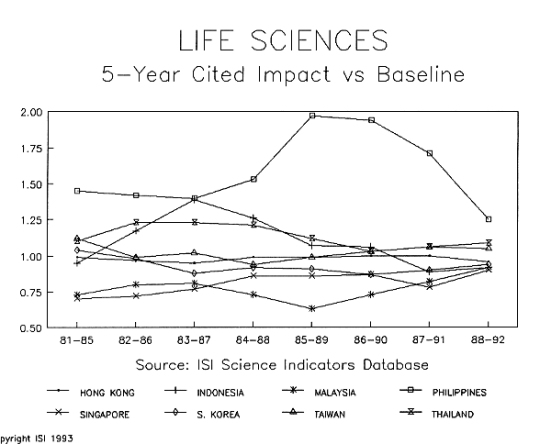
The following viewgraphs compare the ROC's cited impact trends with other leading Pacific Rim nations in these five fields, starting with all sciences combined.
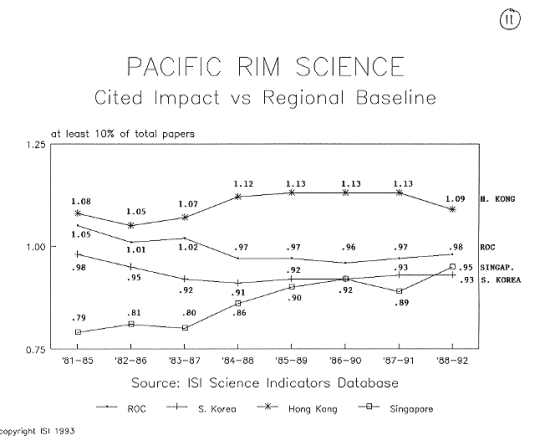
VIEWGRAPH 11: PAC. RIM SCIENCE, BASELINE CITED IMPACT TRENDSEach of the 4 nations shown here accounted for at least 10 percent of total Pacific Rim science papers--ROC (33%), South Korea (20%), Hong Kong (15%), and Singapore (10%).
Two are consistently at or above the average for the eight-nation Pacific Rim group. Hong Kong's research is consistently cited about 10 percent more often than the regional average. And Taiwan virtually matched the regional average over the entire period.
Two are consistently below the Pacific Rim average. South Korea slipped slightly, from nearly equaling it early on but ending up 7 percent below. Singapore started out as a distant fourth, being cited 20 percent below the regional average for the first three periods. It then improved considerably, enough to overtake South Korea for third place by 1988-92, with a cited impact 5 percent below the regional average.
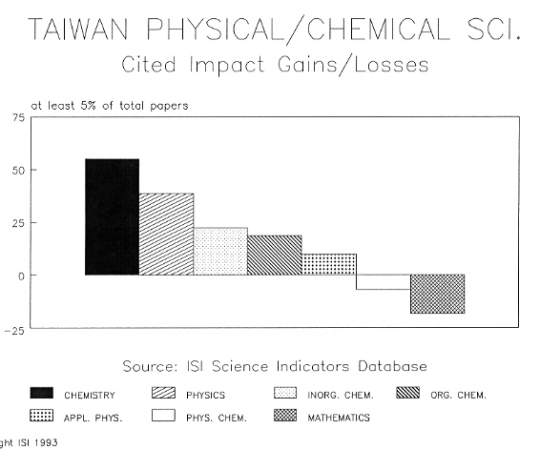
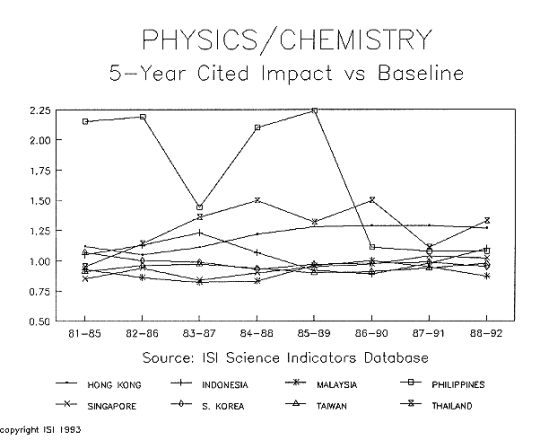
Lets move on now to compare the Pacific Rim leaders in the physical and chemical sciences.
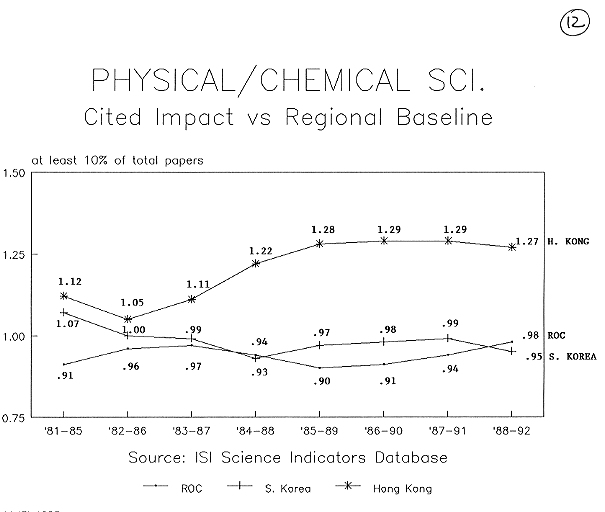
VIEWGRAPH 12: PAC RIM PHYS/CHEM: CITED IMPACT TRENDS, 1981-92In this field, 3 nations accounted for more than 10 percent of regional papers--the ROC (40%), South Korea (35%), and Hong Kong (10%).
Hong Kong is the undisputed leader, increasing its first-rank cited impact from 12 to 27 percent above average. South Korea follows, basically matching the regional average over the 12-year period but ending 5 percent below.
The ROCs performance is typically about 10 percent below average. However, it improved slightly in the most-recent period to match the regional average and virtually share second place with South Korea.
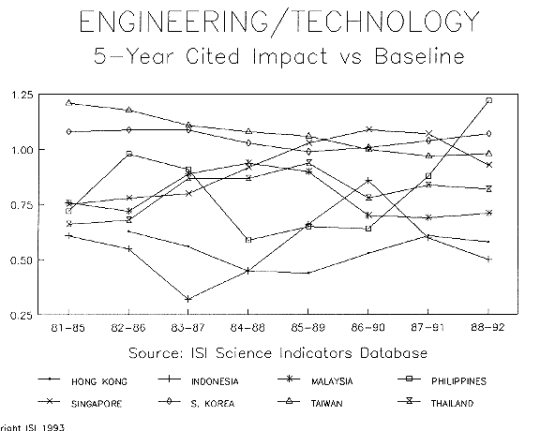
Lets now move on to the Pacific Rim leaders in engineering and technology.
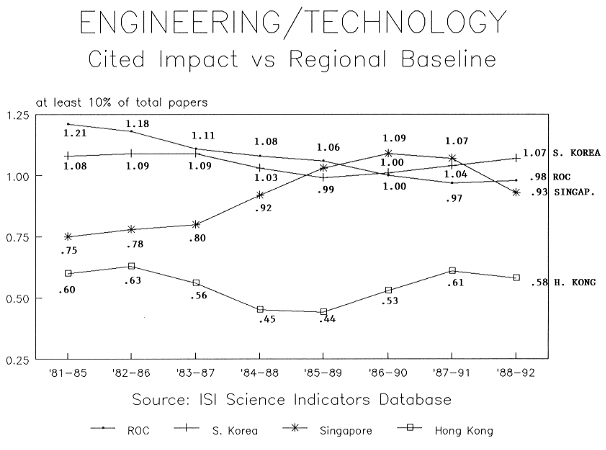
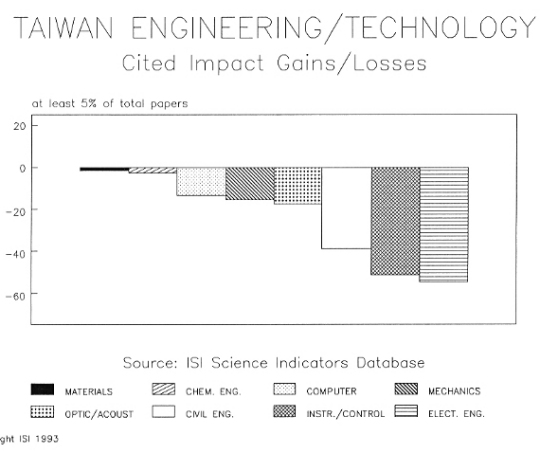
VIEWGRAPH 13: PAC RIM ENG/TECH, CITED IMPACT TRENDS, 1981-92
Four nations accounted for at least 10 percent of Pacific Rim papers in this field--the ROC (44%), South Korea (26%), Singapore (13%), and Hong Kong (10%).
Two nations consistently exceed or meet the regional cited impact average. The ROC ranked first at the beginning of the period with a cited impact 21 percent higher than the Pacific Rim group. It ended in second place, virtually equaling the regional average. South Korea began and ended with a cited impact about 10 percent higher than the average, and ranked first by 1988-1992.
Two nations were consistently below the Pacific Rim cited impact average. Singapore remained in third place, starting at 25 percent below average and improving to 7 percent below. Hong Kong's relative cited impact remained fairly steady at 40 percent below average over the period.
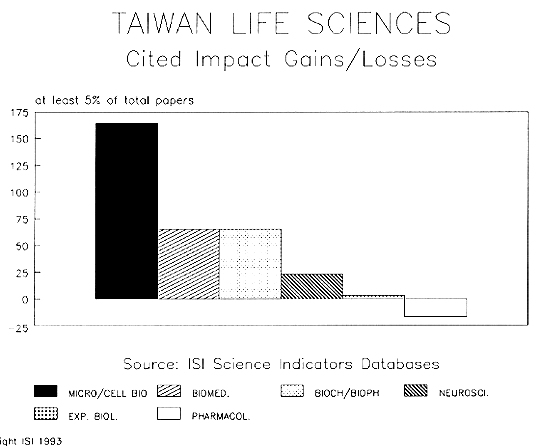
The following viewgraph shows cited impact trends for the Pacific Rim leaders in the life sciences.
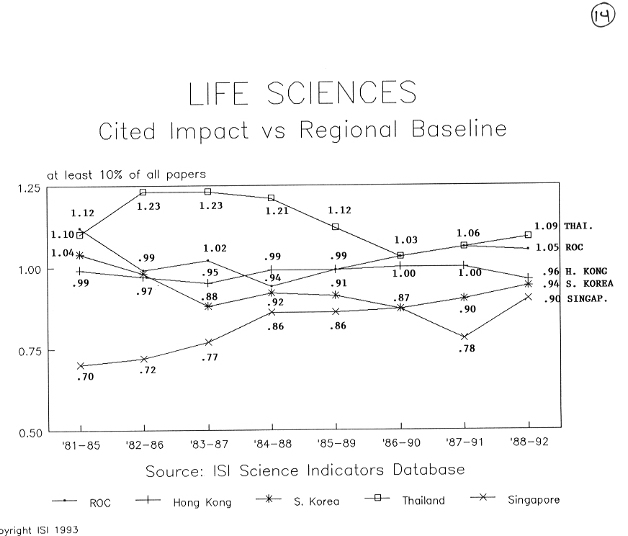
VIEWGRAPH 14: PAC RIM LIFE SCI, CITED IMPACT TRENDS, 1981-92
Five nations accounted for at least 10 percent of all Pacific Rim papers in this field--the ROC (29%), Hong Kong (23%), South Korea (15%), Thailand (12%), and Singapore (11%).
Three nations consistently exceed or equal the regional average. The ROC and Thailand basically share first place, each exceeding the average by 10 percent at the beginning and 5 to 10 percent at the end of the period. Hong Kong consistently equaled the average throughout the period.
Two nations were below the regional average. South Korea basically equaled the average for the first two periods, but thereafter declined to remain 10 percent below. Singapore showed steady improvement, starting at 30 percent below average and ending just 10 percent below average.
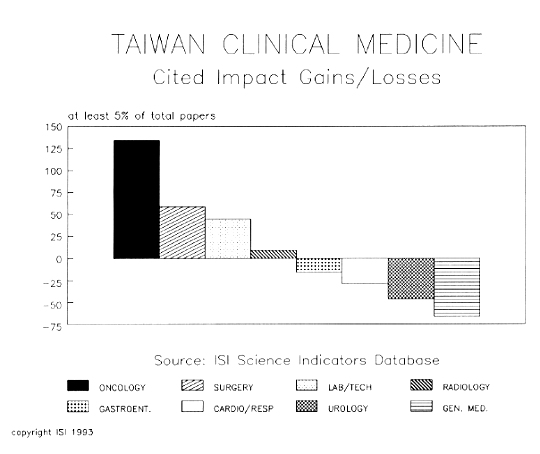
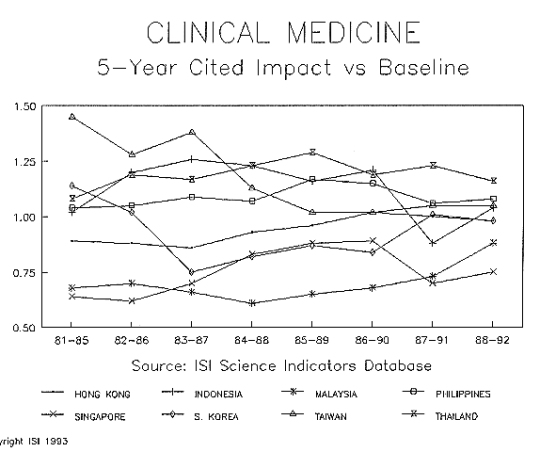
Let's now move on to compare the Pacific Rim nations' performance in clinical medicine.
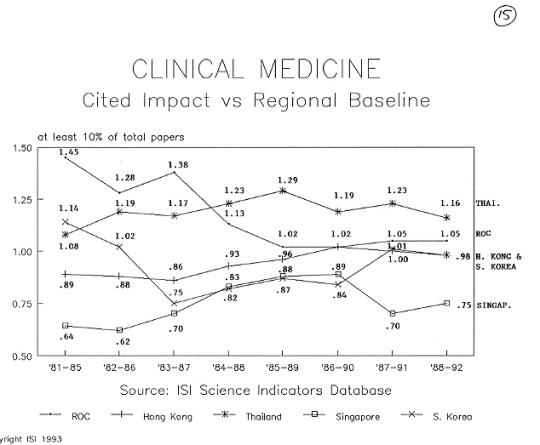
VIEWGRAPH 15: PAC RIM CLIN MED CITED IMPACT TRENDS, 1981-92Five nations each produced at least 10 percent of Pacific Rim papers in clinical medicine--Hong Kong (23%), the ROC (21%), Thailand (16%), Singapore (15%), and South Korea (12%).
Two nations consistently exceeded or equaled the regional cited impact average. The ROC ranked first at the beginning of the period with a cited impact 45 percent higher than the regional average. However, this declined steadily and the ROC was in second place after Thailand at the end of the period with a cited impact 5 percent higher than average. Thailand's cited impact was consistently above average by about 20 percent throughout the period.
South Korea started with a cited impact 14 percent higher than average but declined to 25 percent below average. It then rebounded to equal the regional average by the end of the period. Hong Kong was consistently below average by about 10 percent before it equaled the regional average by the end of the period, sharing third place with South Korea.
Only Singapore consistently fell short of the Pacific Rim cited impact average. It began the period being 36 below average and ended the period at 25 percent below.
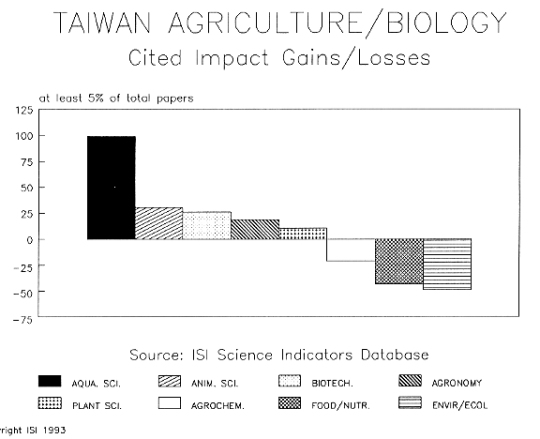
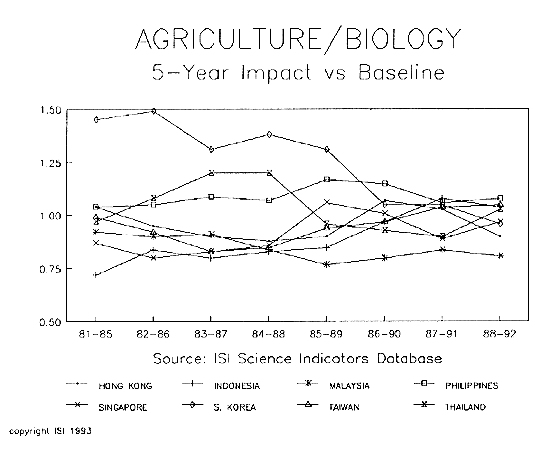
The following viewgraph shows cited impact trends for the Pacific Rim leaders in the final field for comparison, agriculture and biology.
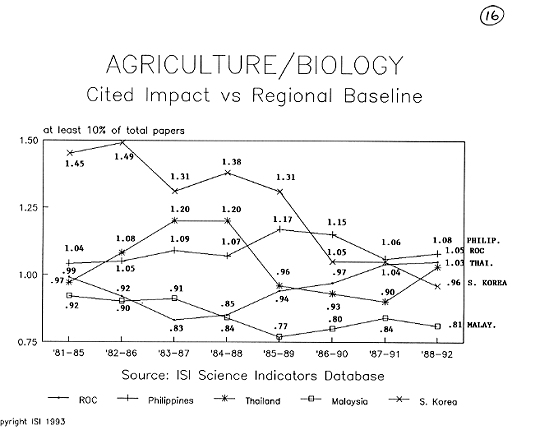
VIEWGRAPH 16: PAC RIM AGRO/BIOL CITED IMPACT TRENDS, 1981-92
Five nations produced at least 10 percent of all Pacific Rim papers in this field--the ROC (26%), the Philippines (18%), Thailand (14%), Malaysia (13%), and South Korea (10%).
South Korea showed the greatest decline. Its cited impact was 55 percent above average at the beginning and ended 4 percent below, ranking fourth.
The ROC started out equal to the regional average at the beginning, then fell 17 percent below average before increasing to end the period 5 percent above. It then was second only to the Philippines, which consistently exceeded the regional average by 10 percent.
Only Malaysia consistently fell short of the regional average in agriculture and biology. Its cited impact was 8 percent below average at the beginning of the period and 19 percent below at the end.
In summary, the ROC consistently ranked among the top Pacific Rim nations in all fields of science in terms of relative cited impact. In the most recent 5-year period, 1988-1992, the ROC ranked a close second to the Philippines in agriculture and biology. In the life sciences, the ROC basically shared first place with Thailand. In clinical medicine, the ROC ranked second after Thailand. The ROC also ranked second in engineering and technology, after South Korea. In physics and engineering, the ROC ranked second after Hong Kong. And in all science fields combined, the ROC ranked second after Hong Kong.
Having examined broad statistical trends for the ROC and the Pacific Rim, we will now focus at a more specific level on ROC science. That is, we will identify the highest impact papers from the ROC that were published and cited in the period 1981- 1992.
The following series of viewgraphs lists 20 papers that were cited at least 80 times.
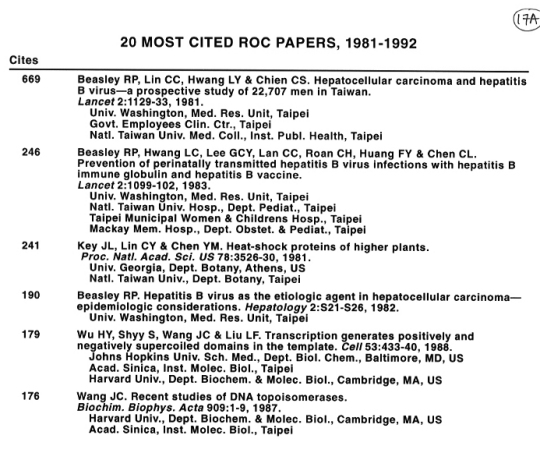
VIEWGRAPH 17A: MOST CITED ROC PAPERS, 1981-1992The highest impact paper--with 669 citations--is on hepatitis B virus and hepatocellular carcinoma. Published in the 1981 Lancet, it was authored by R.P. Beasley of the University of Washington Medical Research Unit in Taipei and colleagues at the
Government Employees Clinic Center and the National Taiwan University Medical College. This paper clearly is a Citation Classic and we have invited the authors to comment on it for Current Contents.
The second and fourth papers shown here are also by Beasley and colleagues. In fact, he accounts for 7 of the 20 most-cited ROC papers, all of them dealing with hepatitis B virus. Thus, several of his co-authors also account for multiple papers on the list. L.Y. Hwang appears on 6 papers, C.C. Lin on 5, W. Szumess on 3, and the following authors account for two papers each -- F.J. Hsieh, T.S. Sun, and K.Y. Wang.
The last two papers on the screen--with 179 and 176 citations--describe DNA studies. J.C. Wang is a co-author on the first and the sole author of the other. Wang also appears on another DNA paper on the list. It is interesting to note that these high impact papers were published recently--two in 1988 and one in 1987.
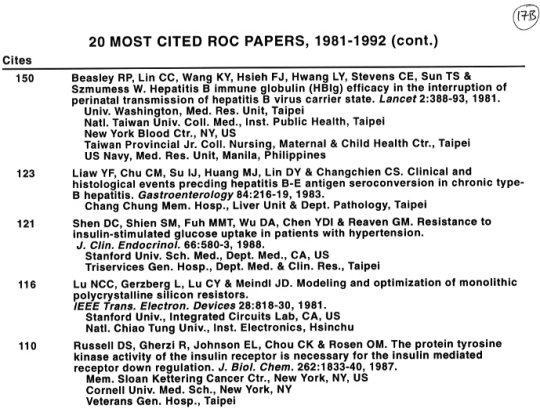
VIEWGRAPH 17B: MOST-CITED ROC PAPERS, 1981-1992 (cont.)The first paper shown here is another by R.P. Beasley and colleagues.
The second paper--with 123 citations -- is a 1983 Gastroenterology paper on hepatitis B. Two of its authors, Y.F. Liaw and C.M. Chu, also appear on another hepatitis B paper on the list.
The fourth paper shown here--with 116 citations--is interesting to note because it is the first physical sciences papers on the list. Published in the 1981 IEEE Transactions on Electronic Devices, it discusses research on silicon resistors. As it turns out, it is among the 30 most-cited papers from this journal.
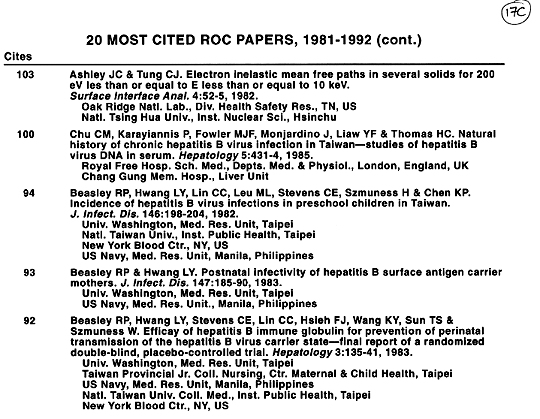
VIEWGRAPH 17C: MOST-CITED ROC PAPERS, 1981-92 (cont.)
Since time is short, my comments will focus on general statistics about these papers rather than their specific topics. In terms of institutions, the National Taiwan University, Taipei, accounted for 6 of the 20 highest impact ROC papers. Of these, 5 were from the College of Medicine and 1 from the Botany Department. Four papers were from the Academia Sinica, Taipei, and 3 each from Chang Gung Memorial Hospital, Taipei, and the Veterans General Hospital, Taipei. The Taiwan Provincial Junior College of Nursing, Taipei, accounted for 2 papers.
The following institutions each accounted for one paper:
Government Employees Clinical Center, Taipei; Mackay Memorial Hospital, Taipei; National Chiao Tung University, Hsinchu; National Taiwan University Hospital, Taipei; National Tsing Hua University, Hsinchu; National Yang Ming Medical College, Taipei; Taipei Municipal Women and Childrens Hospital, Taipei; and the Triservices General Hospital, Taipei.
The following viewgraph shows the remaining highest impact ROC papers
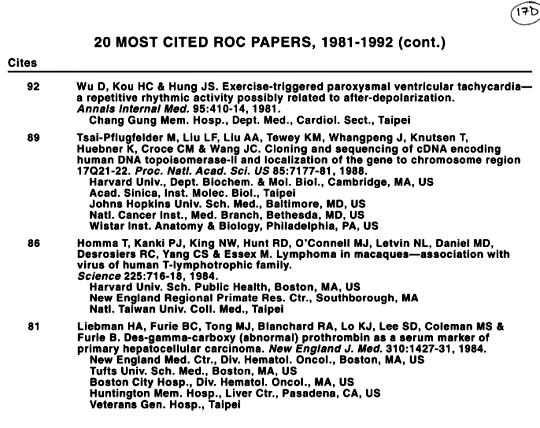
VIEWGRAPH 17D: MOST-CITED ROC PAPERS, 1981-92 (cont.)In terms of national collaboration, US institutions appeared on 13 of the 22 papers. The Philippines accounted for 4 papers, but all of these were from the US Navy Medical Research Unit. Both the UK and Germany appeared on 1 paper each.
From this database of ROC papers, it is fairly straightforward to generate lists of institutions and authors ranked by productivity, total citations, and impact. The following viewgraphs show the 20 most productive ROC institutions from 1981 through 1992.
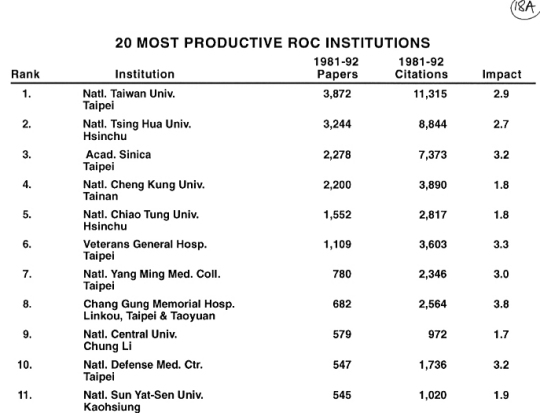
VIEWGRAPH 18A: 20 MOST PRODUCTIVE ROC INSTITUTIONS, 1981-92
The National Taiwan University ranks first with more than 3,800 papers published in 1981-1992. They received about 11,300 citations during this period, giving an overall impact of 2.9
The National Tsing Hua University is second with about 3,200 papers, which received 8,800 citations. Thus, its overall impact was 2.7
The Academia Sinica ranks third with about 2,300 papers, followed closely by the National Cheng Kung University with 2,200. But the Academys papers received nearly twice as many citations--3,900 compared to 2,800. Thus, its impact is almost double--3.2 versus 1.8
Two additional institutions produced over 1,000 papers -- National Chiao Tung University (1,552) and the Veterans General Hospital (1,109).
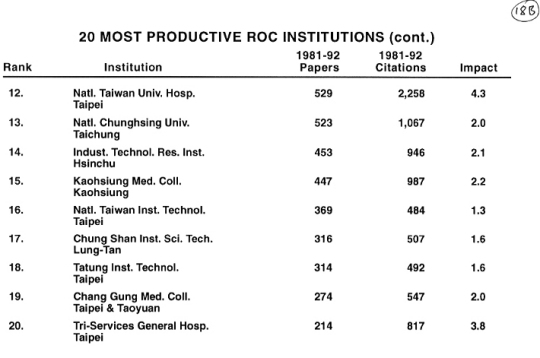
VIEWGRAPH 18B: 20 MOST PRODUCTIVE ROC INSTITUTIONS, 1981-92 (cont.)The remaining most productive ROC institutions are shown here.
Of course, productivity is perhaps the most traditional quantitative indicator used to measure the performance of institutions, departments, nations, individuals, and so on. ISIs data introduce a new way of ranking institutions--by the total number of citations they receive.
The following viewgraphs identify the 20 most-cited ROC institutions for papers published and cited during the period 1981 through 1992. Only those institutions that produced at least 25 papers are included. This excludes the occasional statistical "outlier"--institutions that may have high citation rankings based on just one or a few highly cited papers. By setting an arbitrary threshold of 25 papers, the list will include those institutions that consistently produced papers throughout the 12-year period.
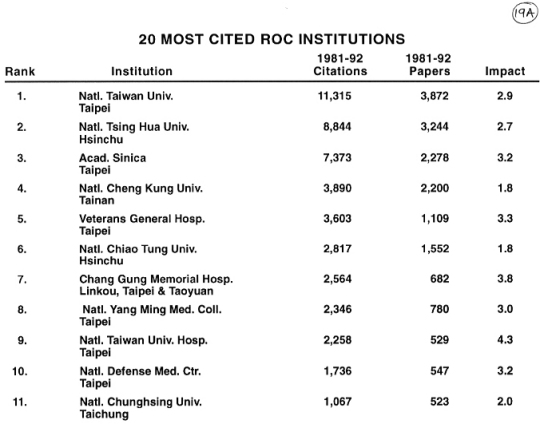
VIEWGRAPH 19A: 20 MOST-CITED ROC INSTITUTIONS, 1981-92
Virtually all of the institutions listed here also appeared on the previous list of most-productive institutions. The only difference is slight changes in the rankings. Thus we will not need to spend time discussing this list. I should point out that complete copies of this presentation and all the data will be made available to you for review at your own convenience.
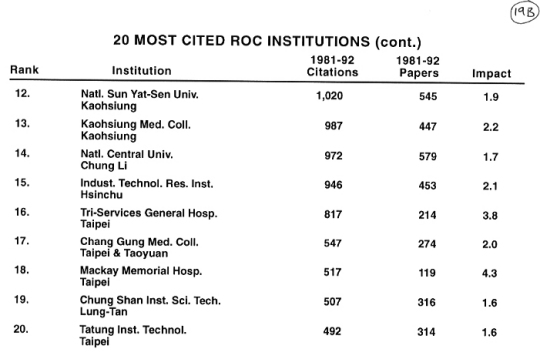
VIEWGRAPH 19B: 20 MOST-CITED ROC INSTITUTIONS, 1981-92 (cont.)This viewgraph shows the remaining most-cited ROC institutions. The only one that did not also appear on the list of high productivity institutions is the Mackay Memorial Hospital, ranked 18th with 517 citations to 119 papers. This gives an overall impact of 4.3.
Another way to rank institutions is by impact. The following viewgraph shows the 20 highest impact ROC institutions for papers published and cited from 1981 through 1992. Actually, 22 institutions are listed because three tied for 20th place in the rankings. Only those institutions that produced at least 25 papers are included.
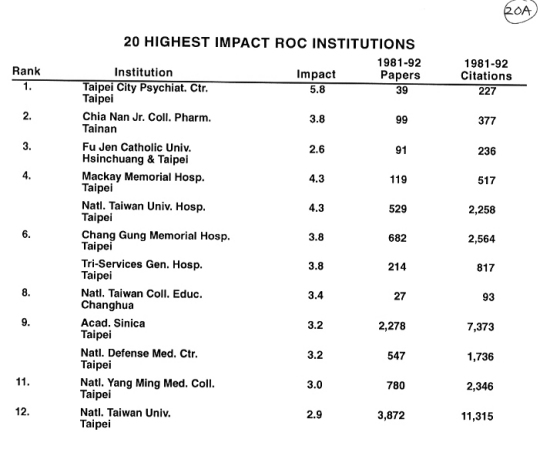
VIEWGRAPH 20A: 20 HIGHEST IMPACT ROC INSTITUTIONS,
1981-92The highest impact ROC institution is the Taipei City Psychiatric Center, Taipei. It produced 39 papers that received 227 citations for an overall impact of 5.8.
The Chia Nan Junior College of Pharmacy, Tainan, ranks second with an impact of 3.8. It produced 99 papers cited 377 times.
Third is the Fu Jen Catholic University, Hsinchuang and Taipei, with an impact of 2.6 based on 91 papers with 236 citations.
It is interesting to note that none of these three highest impact institutions appeared on the previous lists of most productive and most-cited institutions.
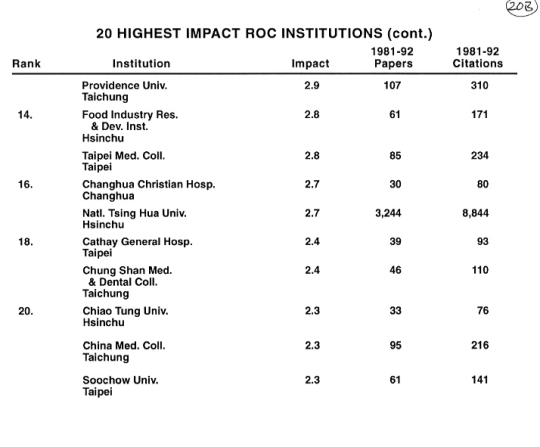
VIEWGRAPH 20B: 20 HIGHEST IMPACT ROC INSTITUTIONS,
1981-92This viewgraph shows the remaining highest impact ROC institutions. Of the 22 institutions listed, 13 did not appear on the previous lists of most-productive and most-cited institutions. This is typically the case in virtually all ISI studies of nations or disciplines.
Lets now move on to identify the 20 most productive ROC authors, shown in the following viewgraph. I should point out that this study includes all authors and is not restricted only to primary authors.
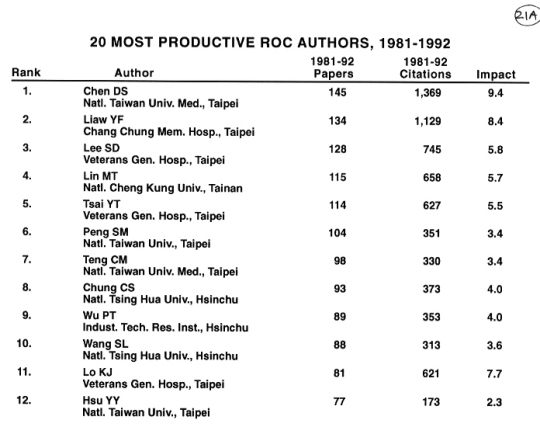
VIEWGRAPH 21A: MOST-PRODUCTIVE ROC AUTHORS, 1981-92
D.S. Chen of the National Taiwan University College of Medicine produced the most papers during this 12-year period-- 145. They received 1,369 citations for an overall impact of 9.4.
Five other authors produced more than 100 papers each - -Y.F.Liaw, Chang Chung Memorial Hospital (134); S.D. Lee, Veterans General Hospital (128); M.T. Lin, National Cheng Kung University (115), Y.T. Tsai, Veterans General Hospital (114); and S.M. Peng, National Taiwan University (104).
The following viewgraph shows the remaining most productive ROC authors.
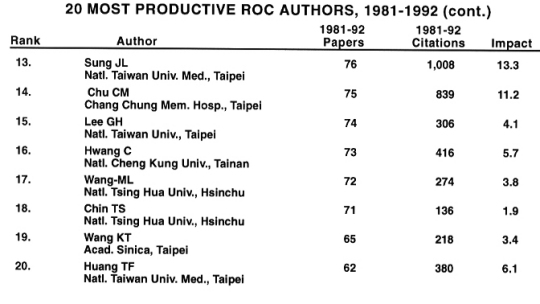 VIEWGRAPH 21B: MOST PRODUCTIVE ROC AUTHORS,The list is fairly straightforward and self-explanatory, so I will make some general bibliographic points. One problem with compiling lists such as this is homographs. That is, two authors with the same surname and initials. In these lists, every effort was made to ensure that homographs were deleted from the rankings. This was done by checking addresses in several annual files of the SCI on compact disk.
1981-92 (cont.)
Lets now identify the most-cited ROC authors.
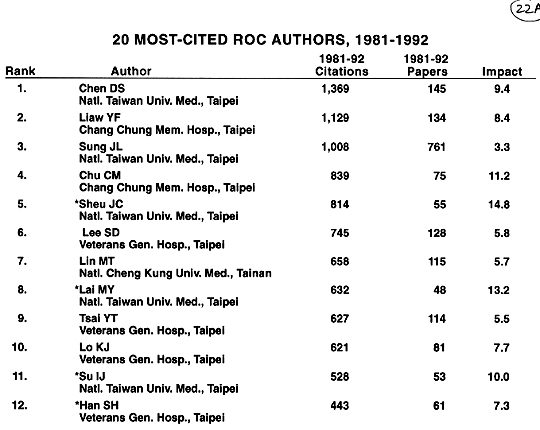
VIEWGRAPH 22A: MOST-CITED ROC AUTHORS, 1981-92
The most-cited author is D.S. Chen, who also ranked first in productivity on the previous list. Two other authors were cited over 1,000 times--Y.F. Liaw and J.L. Sung, National Taiwan University College of Medicine.
The asterisks indicate authors who were not on the list of most-productive authors. Of the 20 authors listed here, 7 were not in the rankings by productivity.
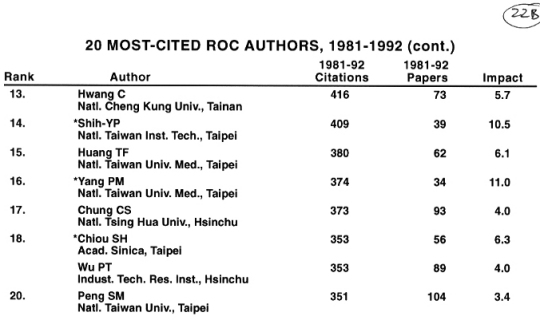
VIEWGRAPH 22B: MOST-CITED ROC AUTHORS, 1981-92 (cont.)
This shows the remaining mostcited authors. The asterisks indicate authors who did ~ rank among the 20 most productive ROC authors.
Lets now move on to identify the highest impact ROC authors for papers published and cited from 1981 through 1992.
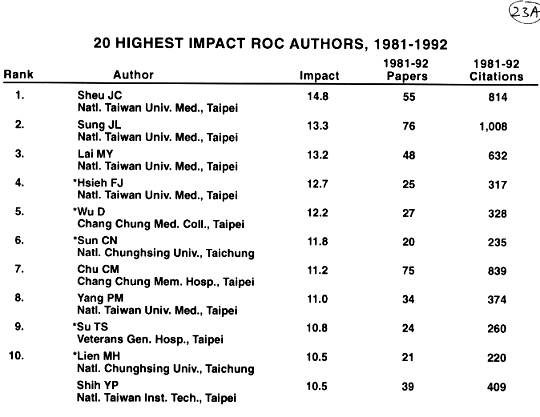
VIEWGRAPH 23A: HIGHEST IMPACT ROC AUTHORS, 1981-92The highest impact author is J.C. Sheu of the National Taiwan University College of Medicine, with 55 papers that received 814 citations. This gives an overall impact of 14.8.
Two authors are virtually tied for second place J.L. Sung (13.3) and N.Y. Lai (13.2), both of the National Taiwan University College of Medicine.
Both Sheu and Lai were among the most-cited authors reviewed earlier. And Sung ranked among both the most productive and most-cited authors.
The asterisks indicate authors who did not appear on either list of most-cited or most-productive authors.
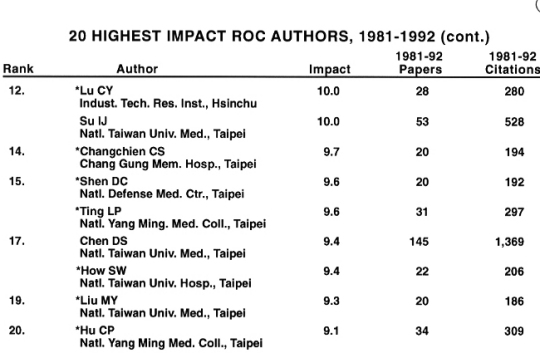
VIEWGRAPH 23B: HIGHEST IMPACT ROC AUTHORS, 1981-92 (cont.)
Of the 20 authors listed, 4 also were among the most-cited authors and 3 were among both the most-cited and most-productive authors. However, 12 authors on this list did not appear on either previous ranking.
This concludes our citationist perspective on current science in the ROC. I hope this presentation has demonstrated that citation analysis provides an interesting and unique perspective on national, institutional, and individual scientific achievement. Of course, like other quantitative indicators, citation data have their advantages and limitations. And like other quantitative indicators, their appropriate and balanced interpretation requires the input of information specialists working with knowledgeable scientists.
In particular, conclusions drawn from citation data on individuals require special care and attention. Citation data do not necessarily measure precisely the "quality" or "significance" of an individuals work. These are subjective judgments that require careful peer review and assessment by specialists familiar with the research topic in question. Rather, citation data indicate the use of an individuals work by other scientists. That is, citations are formal acknowledgments of intellectual debt, indicating that an idea or method in some way influenced subsequent research. As such, they should be an important component of research evaluations and assessments by administrators, policy makers, granting agencies, and others.
As we have learned in countless evaluations of Nobel Class scientists, citation data provide excellent confirmation of peer review judgments. However, due to the large size of the scientific enterprise, the collective memory of evaluation groups is limited. And they can easily overlook important contributions of many individuals and teams.
Thank you for your attention. I would be happy to answer any questions you may have.
OTHER DATA PRESENTED :