Canadian Journal of
Information and Library Science, 18 (4) p.14-35, 1993
What citations tell us about Canadian research
EUGENE GARFIELD
Chairman Emeritus,
Institute for Scientific Information®
Publisher,
The Scientist, Inc.®
3501 Market Street
Philadelphia, PA 19104 USA
Tel. 215-243-2205
Fax 215-387-1266
email: garfield@codex.cis.upenn.edu
Home Page: http://garfield.library.upenn.edu
The
Ian P. Sharp Lecture on Information Science was established in 1990 with
an endowment from Reuters Information Services (Canada) Limited in honour
of its founding president and former chi ef executive officer. The lectureship
is intended to provide a forum for distinguished figures in information
science and related fields. LP. Sharp Associates, one of the world�s leading
numeric database com-panies, was founded by Ian P. Sharp and seven colleagues.
The Canadian company soon expanded, establishing a timesharing service
and pioneering the use of electronic mail. In 1976, the company installed
its own private, packet-switched network and today it supplies the world�s
major financial and economic centres with historical information and financial
products. In June 1987, LP. Sharp Associates was acquired by Reuter Holdings
PLC of London, the world�s largest electronic publisher.
Dr. Garfield, the fourth I.P. Sharp lecturer, delivered the address
that follows at the University of Toronto on April 8, 1993. He was introduced
by his longtime colleagueProfessor Charles Meadow, Faculty of Library andlnformation
Science, University of Toronto.
Introduction
Many
of you are no doubt familiar with the Institute for Scientific Information®
(ISI®) and its many products and services. These include Current
Contents® (CC®), our primary current awareness service, which
is available in print, online, magnetic tape, and floppy diskette. In addition,
the Science Citation Index® (SCI®), Social Sciences Citation
Index® (SSCI®), and Arts & Humanities Citation Index®
(A&HCI®) are our primary information retrieval services. Like CC,
they are available in a variety of fonnats.
In essence, ISI�s products and services are tools for navigating the
scholarly literature. That is, they help researchers, students, administrators,
and others to discover relevant information in the flood of papers published
every week in thousands of journals worldwide. And they help to recover
infonnation you know�or think�is out there somewhere in the vast archive
of published research.
But the topic of this lecture involves the application
of ISI�s databases for purposes other than current awareness and information
retrieval. That is, citation databases are increasingly being used as indicators
for science evaluation (Garfield 1983a; Garfield
1983b; Garfield and Welljams-Dorof 1992).
I cannot provide an exhaustive analysis of Canadian science in the time
available. This lecture will serve to illustrate the variety of perspectives
on Canadian science that are possible with citation data. The examples
will range from the general to the specific, including rankings of nations,
institutions, fields, papers, and authors.
Output and citation of Canadian papers
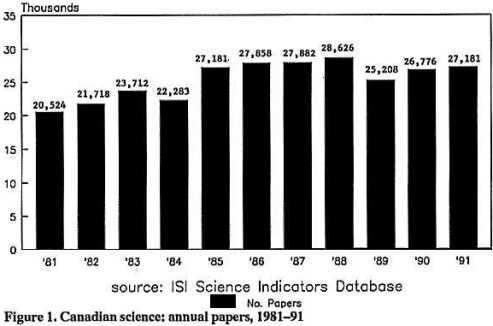
To begin, let�s examine Canadian output in the SCI, shown in Figure
1. There is a clear upward trend in the output of Canadian authors. In
1981 theSCI indexed about 20,500 papers with at least one Canadian address,
compared to over 27,000 in 1991. This represents a growth of 32.4% over
the eleven-year period. Increased collabora-tion could account for this
growth. Collaboration increases absolute output but not necessarily the
average number of papers per author.
Canada�s growth in output is comparable to that of other nations�for
example, papers from Australia grew by 32.4%, from Germany by 25.8%, from
all of Europe by 3 1.0%, and from Japan by 44.5%. And Canada�s output growth
is about three times greater than that of the SCIas a whole (9.7%), the
United States (11.7%), and the United Kingdom (11.3%).
Notice that the growth in Canadian papers is not smooth and steady.
For example, there are slight declines in the years 1989 through 1991 compared
with the previous four years. This is due in part to changes in SCI coverage�the
total number of SCI papers also declined during this three-year period
primarily because the SCI reduced the number of indexed journals since
1986.
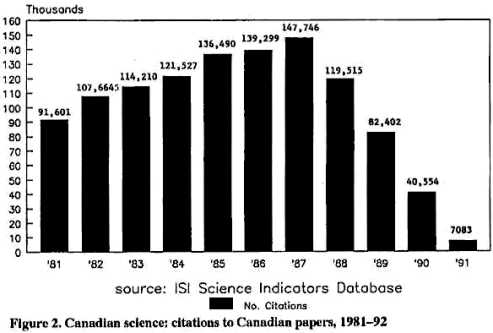
Of course, ISI�s databases can also track the number of citations to
these Canadian papers, which is shown in Figure 2. The clear declining
trend in number of citations in recent years has an obvious explanation�that
is, papers published in earlier years have had more time to accrue citations
than those published more recently. For example, 1981 papers received about
91,600 citations over the eleven-year period from 1981 through 1991. However,
1991 papers received about 7,000 citations in that single year.
Impact of Canadian papers vs world averages
We have developed a method for smoothing out these annual fluctuations
in both numbers of citations and papers. It involves aggregating publication
and citation data over five-year periods. These five-year �windows� overlap
and advance a year at a time.
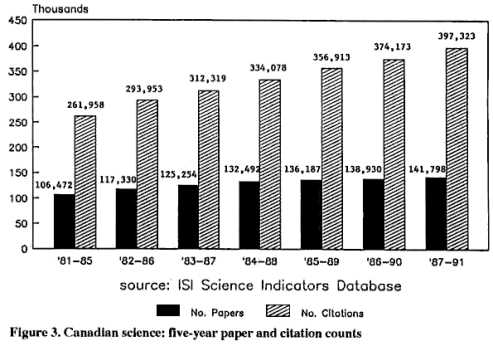
Figure 3 shows the numbers of Canadian papers and citations in these
five-year periods. The number of papers is shown in the solid bars, and
citations in the shaded bars. In these five-year windows, the number of
Canadian papers steadily increases from about 106,000 in 1981�85 to about
142,000 in 1987�91. This is a growth of 38.8%. The number of citations
grew by 5 1.7%, from 262,000 to 397,000 over the same time period.
From these data one can calculate the so-called �impact factor��that
is, the average number of citations per paper published during these five-year
periods. Actually, there are two ways to calculate impact. Citations can
be divided by the total number of papers to give the standard impact factor.
Alternatively, citations can be divided by only the number of papers that
were actually cited. That is, uncited papers are excluded from the calculation.
This results in the so-called �cited� impact factor.
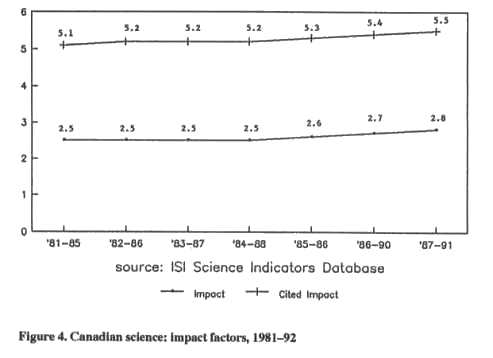
Both impact factors are shown in Figure 4. The top line shows trends
in the five-year �cited� impact of Canadian science, and the bottom line
shows overall impact factors. Both trend lines were stable until the period
1984�88, when each began to steadily increase. Cited impact factors rose
by 7.8% from the beginning to the end of the period, and overall impact
increased by 12.0%. This difference is probably due to lower uncitedness.
One could speculate on the reasons.
It would be interesting to determine if these trends reflect initiatives
by Canadian science policymakers, or changes in the level and allocation
of research funding. Then again, the trends may simply reflect a general
impact �inflation� in other leading research nations. Answers to these
questions require the input of information specialists working closely
with knowledgeable scientists, administrators, and policymakers.
While reviewing impact factor trends for Canadian papers is interesting,
it is perhaps more meaningful to compare them with other nations. One way
to do so is to define a �baseline� for comparison. We use the average impact
factors for the entire SCI file as a baseline.
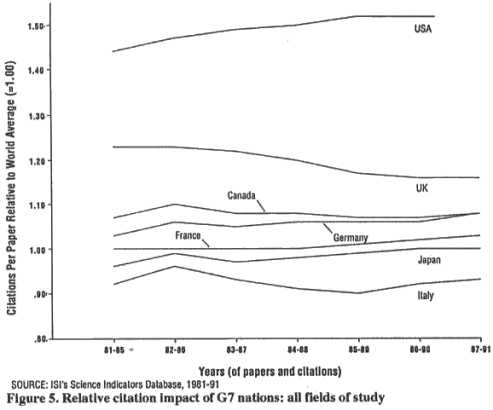
In Figure 5, the citation impact of Canadian papers
is compared with those of the other so-called Group of Seven (G7) nations�the
U.S., the U.K, France, Germany, Italy, and Japan. This graph is taken from
a recent issue of Science Watch, ISI�s monthly newsletter that tracks trends
in research performance (Garfield 1990). The world
average is arbitrarily set at 1.0 throughout the eleven-year period. That
is, if a nation�s impact is higher than the world average, it will have
a value greater than 1.0.
The U.S. shows the highest impact relative to the world average, exceeding
it by about 45% to 50% throughout the period. The U.K. is next, followed
by Canada.
How much greater a nation�s impact is than the world average at any
given point in time is relevant for analysis. However, the trend is perhaps
more important. For example, the U.S. is steadily increasing its relative
impact against the world average. On the other hand, the U.K. is declining�which
should be of some concern to British policymakers.
Canada�s relative impact is fairly stable, with a slightly increasing
trend. Note that Germany�s performance is increasing at a greater rate,
and its relative impact equalled Canada�s by 1987�91. Note also that Japan
matched the world average for the first time in the period 1986�90. It
will be interesting to see if Japan�s scientific progress continues in
future years.
Using the G7 nations as a group for comparison is arbitrary. It is possible
to rank all nations by impact. While the G7 nations still appear in these
lists, their impact often is less than that of comparatively smaller nations
producing fewer papers. This is shown in Table 1, which lists the twenty
highest-impact nations for 1981�90. It includes only those nations producing
at least 10,000 papers.
Switzerland ranks first with an impact of 7.3, based on 66,000 papers
that received 485,000 citations. Sweden and the U.S. rank second, each
with an impact of 6.7. Denmark follows (6.2) and the Netherlands is next
(6.0). Thus, four of the top five are comparatively small nations, in terms
of absolute output. These smaller nations achieved higher impact than the
largest producers�including the U.K., Germany, France, Japan, Italy, and
Canada.
Table 1. Top 20 nations ranked by impact,
1981-90 (at least 10,000 papers)
|
|
Rank
|
Nation |
Impact
|
Papers
|
Citations
|
|
1.
|
Switzerland |
7.3
|
66,180
|
484,935
|
|
2.
|
Sweden |
6.7
|
76,267
|
512,239
|
|
3.
|
United States |
6.7
|
1,763,391
|
11,720,453
|
|
4.
|
Denmark |
6.2
|
38,625
|
240,632
|
|
5.
|
Netherlands |
6.0
|
85,479
|
513,688
|
|
6.
|
United Kingdom |
5.6
|
412,510
|
2,318,115
|
|
7.
|
Fed. Rep.
Germany |
5.5
|
267,878
|
1,465,239
|
|
8.
|
Australia |
5.4
|
91,341
|
489,905
|
|
9.
|
Belgium |
5.4
|
42,608
|
229,408
|
|
10.
|
Canada |
5.3
|
193,141
|
1,025,912
|
|
11.
|
Israel |
5.2
|
49,090
|
254,567
|
|
12.
|
France |
5.1
|
220,983
|
1,115,288
|
|
13.
|
Finland |
5.0
|
27,961
|
139,103
|
|
14.
|
Norway |
4.9
|
23,076
|
112,004
|
|
15.
|
Japan |
4.4
|
301,601
|
1,333,334
|
|
16.
|
Italy |
4.3
|
112,313
|
478,765
|
|
17.
|
New Zealand |
4.2
|
18,617
|
78,794
|
|
18.
|
Ireland |
3.9
|
12,874
|
50,780
|
|
19.
|
Austria |
3.8
|
25,836
|
97,902
|
|
20.
|
Hungary |
3.3
|
21,072
|
69,951
|
|
Field distribution and relative impact of Canadian papers
The data reviewed so far are on science as a whole. ISI �s databases can
also provide insights into the output and impact in broad fields of science
as well as narrow subspecialties. Before we review comparative impact data
for Canadian science in different fields, let�s first examine how Canadian
papers are distributed by field.
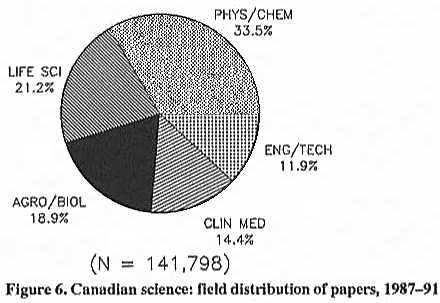
Figure 6 shows the field distribution of about 142,000 Canadian papers
in the most recent five-year period, 1987�91. Keep in mind that these groupings
have some redundancy�that is, overlap in journal coverage. For example,
the Canadian Medical Association Journal is covered in both the life sciences
and the clinical medicine editions of Current Contents. However,
this overlap is consistent for all nations in the database.
Following the Current Contents journal groupings, the physical and chemical
sciences include mathematics and the earth sciences. This group accounts
for the largest share�33.5%.
The life sciences, with 21.2% of papers, include molecular biology,
genetics, biochemistry, microbiology, cell biology, and so on. This group
is followed by agriculture and biology (18.9%), which includes biotechnology,
plant science, aquatic and environmental science, and clinical medicine
(14.4%). Of course, all three of these fields could be considered as the
life sciences in general, and they would account for 55% of Canadian papers.
The last group�engineering and technology (11.9%)�includes materials science,
optics, acoustics, mining, etc.
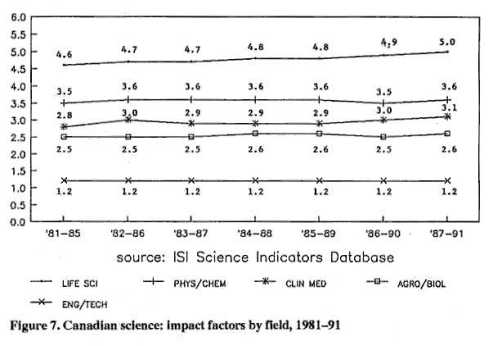
Figure 7 shows impact trends for Canadian papers in these fields. Canadian
life sciences papers show the highest impact factors. Their impact increased
by 8.7%, from 4.6 to 5.0 over the eleven-year period. However, clinical
medicine papers showed the highest impact gain�a 10.7% increase.
This graph reinforces an important point that deserves to be stressed:
impact factors vary by field and subspecialty. Typically, the life sciences
have the highest impact. This is due, in part, both to the larger population
of researchers and papers in this field, as well as the higher average
number of references per life sciences paper, compared with other fields.
Thus, when conducting citation evaluations of nations, institutions, departments,
authors,
or whatever, analysts ought to use field-specific output, citation, and
impact averages to make valid comparisons and draw appropriate conclusions.
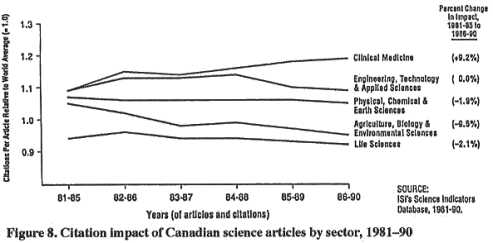
As noted earlier, while it is interesting to review absolute impact
factors for a nation, it is perhaps more meaningful to compare them with
groups of other nations. Figure 8 compares Canada �s impact versus the
world average for each of these fields. The impact of Canadian papers consistently
exceeded the world average in three fields�clinical medicine, engineering
and technology, and the physical and chemical sciences.
As noted previously, however, the trend in a nation�s impact may be
more meaningful than the actual percentage above or below the world average.
For example, the impact of Canadian papers in clinical medicine, relative
to the world average, increased by 9.2% from the beginning to the end of
the period. It is reasonable to ask whether the growth of multinational
clinical studies have some bearing on this trend. On the other hand, agriculture
and biology papers declined in relative impact by 9.5%.
Of course, it is possible within each of these fields to compare Canada�s
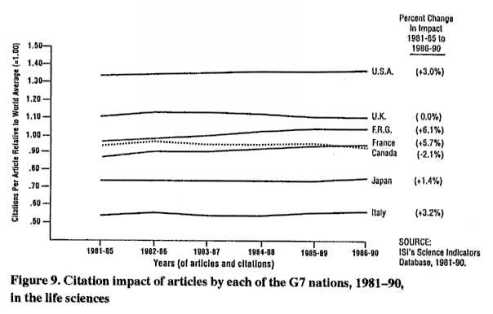
performance with that of other specific nations as well as the world average.
This is illustrated in Figure 9, which shows impact trends, relative to
the world average, for the G7 nations in the life sciences. The U.S. had
a higher relative impact than the world average by 30 to 40%, and its impact
increased by 3% over the eleven-year period. The performance of the U.K.
was relatively unchanged, while Germany�s relative impact increased by
6.1%, more than any other nation shown here.
As noted earlier, Canada�s relative impact declined by 2.1%, shown by
the dotted line. France improved by 5.7%, sufficient to overtake Canada
in the most recent period, 1986�90. It is possible that the French improvement
may be due to increased publication in English-language journals.
Highest-impact Canadian institutions
Having reviewed citation data at the national level, let�s move on to the
next level of specificity�that is, institutions. Table 2 identifies the
twenty highest-impact Canadian institutions in the life sciences. It includes
institutions that produced at least 1,000 life sciences papers from 1981
through 1991. The boxed line of data shows the average impact of all Canadian
institutions for the period 1981�91. Eight of the twenty institutions exceeded
the national average in the life sciences. Three have impacts greater than
10�McMaster University (10.7), the University of Toronto (10.6), and Queen�s
University (10.4).
Table 2. The 20 highest-impact Canadian
institutions, 1981�91: life sciences (at least 1,000 papers)
|
|
Rank
|
Institution |
Impact
|
Papers
|
Citations
|
|
1.
|
McMaster |
10.7
|
5,565
|
59,298
|
|
2.
|
Toronto |
10.6
|
22,517
|
239,654
|
|
3.
|
Queen�s |
10.4
|
3,445
|
35,651
|
|
4.
|
McGill |
9.7
|
12,789
|
124,019
|
|
5.
|
British Columbia |
8.7
|
10,396
|
90,382
|
|
6.
|
Western Ontario |
8.2
|
6,367
|
52,126
|
|
7.
|
Dalbousie |
8.0
|
3,745
|
29,916
|
|
8.
|
Sherbrooke |
8.0
|
1,543
|
12,321
|
| |
All-Canada
average |
7.7
|
121,646
|
937,695
|
|
9.
|
Alberta |
7.6
|
7,879
|
59,650
|
|
10.
|
Calgary |
7.5
|
4,634
|
34,787
|
|
11.
|
Laval |
7.4
|
4,361
|
32,078
|
|
12.
|
Montréal |
7.4
|
6,730
|
49,892
|
|
13.
|
Manitoba |
7.2
|
5,432
|
39,019
|
|
14.
|
Memorial |
6.6
|
1,735
|
11,364
|
|
15.
|
Ottawa |
6.6
|
3,341
|
21,965
|
|
16.
|
Waterloo |
6.0
|
1,888
|
11,332
|
|
17.
|
Simon Fraser |
5.8
|
1,223
|
7,114
|
|
18.
|
Saskatchewan |
5.6
|
4,294
|
23,948
|
|
19.
|
Guelph |
5.0
|
6,157
|
30,617
|
|
20.
|
Québec |
4.5
|
1,346
|
6,036
|
|
A different ranking of universities is obtained for the physical
and chemical sciences, as shown in Table 3. Ten institutions exceed the
national average impact in this field. The only one with an impact higher
than 7.0 is the University of Guelph (7.4), which ranked 19th in the life
sciences. The University of Toronto is a close second (6.9), followed by
the University of British Columbia (6.6) and the Université de Montréal
(6.6).
Most-cited and highest-impact authors
One can also obtain impact rankings of authors as well as institutions,
nations, etc. Table 4 identifies the twenty most-cited Canadian authors
who produced at least twenty-five papers from 1981 through 1990. It also
shows their current institutional affiliations.
Two authors received more than 8,000 citations�M. Cantin (8,530)and
J. Genest (8,494), both of the Clinical Research Institute, Montreal. In
fact, this institute dominates the list. Six of the ten most-cited authors
are based there.
Another way to view authors is in terms of impact, or average citations
per paper. Typically, impact rankings identify a different group than lists
of the most cited or most productive authors, institutions, nations, or
whatever. This is seen in Table 5, which lists the twenty highest-impact
Canadian authors for papers published and cited from 1981 through 1990.
Only those authors who produced at least twenty-five papers are included.
The highest-impact author is A.J. de Bold, University of Ottawa, with
forty-three papers that received 3,700 citations for an impact of 85.5.
De Bold also appeared on the list of most-cited authors, as indicated by
the asterisk. Of the twenty highest-impact authors, only four also were
among the most-cited.
Of the twenty authors listed, four were based at the Hospital for Sick
Children, Toronto. The Ontario Cancer Institute and McGill University are
represented by three authors each. Two authors were from the University
of Toronto�H. Sonnenberg and N. Isgur.
The impact of these authors ranged from 30 to 85.5, which is five to
fifteen times greater than the national average impact during this period
(5.6).
Table 3. The 20 highest-impact Canadian
universities, 1981�91: physical sciences (at least 1,000 papers)
|
| Rank |
Institution |
Impact
|
Papers
|
Citations
|
|
1.
|
Guelph |
7.4
|
1,350
|
9,935
|
|
2.
|
Toronto |
6.9
|
6,283
|
43,474
|
|
3.
|
British Columbia |
6.6
|
4,494
|
29,643
|
|
4.
|
Montréal |
6.6
|
2,052
|
13,521
|
|
5.
|
McMaster |
5.8
|
3,172
|
18,494
|
|
6.
|
York |
5.8
|
1,095
|
6,339
|
|
7.
|
Simon Fraser |
5.7
|
1,431
|
8,167
|
|
8.
|
Dalhousie |
5.6
|
1,498
|
8,321
|
|
9.
|
Alberta |
5.6
|
4,361
|
24,475
|
|
10.
|
Western Ontario |
5.6
|
2,479
|
13,966
|
|
All-Canada average |
5.2
|
69,616
|
363,849
|
|
11.
|
Queens |
5.0
|
2,014
|
9,972
|
|
12.
|
Ottawa |
5.0
|
2,057
|
10,360
|
|
13.
|
Waterloo |
4.9
|
3,988
|
19,380
|
|
14.
|
McGill |
4.8
|
3,852
|
18,508
|
|
15.
|
Saskatchewan |
4.5
|
1,393
|
6,242
|
|
16.
|
Calgary |
4.1
|
2,170
|
8,897
|
|
17.
|
Laval |
3.9
|
1,672
|
6,556
|
|
18.
|
Manitoba |
3.7
|
1,842
|
6.730
|
|
19.
|
Québec |
3.4
|
1,164
|
3,931
|
|
20.
|
Concordia |
2.5
|
1,294
|
3,266
|
|
Table 4. The 20 most-cited authors,
1981�90
|
| Rank |
Author
|
Citations
|
Papers
|
Impact
|
|
1.
|
M. Cantin, Clin. Res. Inst. |
8,530
|
372
|
22.9
|
|
2.
|
J. Genest, Clin. Res. Inst. |
8,494
|
333
|
25.5
|
|
3.
|
T.W. Mak, Ont. Cancer Inst. |
5,912
|
126
|
46.9
|
|
4.
|
G. Thibault, Clin. Res. Inst. |
5,593
|
214
|
26.1
|
|
5.
|
J. Gutkowska, Clin. Res. Inst. |
5,392
|
274
|
19.7
|
|
6.
|
R. Garcia, Clin. Res. Inst. |
4,963
|
185
|
26.8
|
|
7.
|
Grinstein, Hosp. Sick Chil. |
4,362
|
154
|
28.3
|
|
8.
|
F. Labrie, Laval |
4,319
|
355
|
12.2
|
|
9.
|
M. Chrétien, Clin. Res. Inst. |
3,961
|
211
|
18.8
|
|
10.
|
A.J. de Bold, Ottawa |
3,676
|
43
|
85.5
|
|
11.
|
N.G. Seidah, Clin. Res. Inst. |
3,623
|
171
|
21.2
|
|
12.
|
V. Ling, Ont. Cancer Inst. |
3,607
|
82
|
44.0
|
|
13.
|
E.W. Gelfand, Hosp. Sick Chil. |
3,505
|
176
|
19.9
|
|
14.
|
K.U. Ingold, Nat. Res. Council |
3,345
|
160
|
20.9
|
|
15.
|
H. Sonnenberg, Toronto |
3,343
|
86
|
38.9
|
|
16.
|
J. Hirsh, McMaster |
3,301
|
260
|
12.7
|
|
17.
|
P. Seeman, Toronto |
3,271
|
116
|
28.2
|
|
18.
|
J.C. Scalano, Nat. Res. Council |
3,198
|
211
|
15.2
|
|
19.
|
H.C. Fibiger, Brit. Columbia |
3,186
|
138
|
23.1
|
|
20.
|
J. Bienenstock, McMaster |
3,046
|
208
|
14.6
|
|
Table 5. The 20 highest-impact Canadian
authors, 1981�90
|
|
Rank
|
Author
|
Impact
|
Papers
|
Citations
|
|
1.
|
*A.J. de
Bold, Ottawa |
85.5
|
43
|
3,676
|
|
2.
|
W.K. Cavenee,
McGill |
55.6
|
31
|
1,724
|
|
3.
|
T.W. Mak,
Ont. Cancer Inst. |
46.9
|
126
|
5,912
|
|
4.
|
*V. Ling,
Ont. Cancer Inst. |
44.0
|
82
|
3,607
|
|
5.
|
W.F. Anderson,
Alberta |
41.6
|
37
|
1,539
|
|
6.
|
A. Rothstein,
Hosp. Sick Chil. |
39.3
|
65
|
2,556
|
|
7.
|
*H. Sonnenberg,
Toronto |
38.9
|
86
|
3,343
|
|
8.
|
J.R. Riordan,
Hosp. Sick Chil. |
37.5
|
56
|
2,098
|
|
9.
|
R.A. Phillips,
Hosp. Sick Chil. |
34.9
|
77
|
2,685
|
|
10.
|
M. Zuker,
Nat. Res. Council |
33.7
|
38
|
1,282
|
|
11.
|
R.N. Buick,
Ont. Cancer Inst. |
33.5
|
41
|
1,375
|
|
12.
|
R.F.W. Bader, McMaster |
33.4
|
43
|
1,434
|
|
13.
|
DA. Vandenberg,
Victoria |
32.2
|
38
|
1,223
|
|
14.
|
A. Detroyer,
Royal Vic. Hosp. |
31.2
|
39
|
1,215
|
|
15.
|
P. Gros,
McGill |
31.1
|
43
|
1,337
|
|
16.
|
N. Isgur,
Toronto |
31.0
|
45
|
1,393
|
|
17.
|
A.J. Aguayo,
McGill |
30.8
|
38,
|
1,172
|
|
18.
|
A. Laupacis,
Western Ont. |
30.7
|
37
|
1,137
|
|
19.
|
M. Buchwald,
Hosp. Sick Chil. |
30.0
|
48
|
1,439
|
|
20.
|
P. Plot,
Manitoba |
30.0
|
30
|
901
|
|
Most-cited Canadian papers
Let�s now examine the most-cited Canadian papers from 1981 to 1992. Not
surprisingly, the names of some of the authors reviewed on these lists
will appear on these papers. Table 6 identifies eleven papers cited at
least 500 times, which by my definition makes them Citation Classics
(Garfield
1977). The first paper, with 1,665citations, includes two authors who
were on the lists of most-cited and highest-impact authors�de Bold and
Sonnenberg. As shown previously, de Bold received 3,676 total citations
during this period, and Sonnenberg had 3,343. Thus, this single paper accounts
for about half of their total citations.
This illustrates an important point that should be kept in mind in citation
analyses of authors, departments, journals, and so on. That is, citation
distributions tend to be "skewed." For example, a comparatively small proportion
of papers may account for the majority of an author�s or journal�s citations.
Similarly, a relatively small group of authors or research teams may account
for the majority of an institution�s citations. And a nation�s total citation
frequency may be concentrated in a small number of high-impact institutions.
It is obvious from the titles of these papers that all are related to
topics in the life sciences. The interesting exception is the third paper
shown here with 627 citations. It concerns decision-making and the psychology
of choice. The life sciences tend to dominate undifferentiated citation
rankings of papers, journals, authors, and so on. As noted earlier, average
impact in the life sciences is due to the higher number of cited references
per paper, compared with other fields. However, the much larger occurrence
of high-frequency Citation Classics is due to the relative size
of the fields.
Lest we overlook high-impact work in other fields, Table 7 identifies
the most-cited Canadian papers in the physical, chemical, and engineering
sciences. It lists eight papers published from 1981 through 1992 that received
at least 250 citations. The second paper on the list is the most recent,
a 1988 Physical Review B paper concerning superconductivity. Co-authored
by Y. LePage, National Research Council of Canada, Ottawa, and colleagues
at Belleore Research Laboratories, Red Bank, New Jersey, it received 392
citations in five years.
Two authors also appeared on the twenty highest-impact authors list:
D.A. Vandenberg, University of Victoria, whose 1983 paper on star clusters
and stellar evolution received 279 citations; and N. Isgur, University
of Toronto, whose 1985 paper with S. Godfrey concerning mesons and quark
models was cited 268 times.
In addition to identifying the most-cited papers
from the past decade or longer timne periods, ISI�s data can also identify
recently published papers that have achieved high impact. These so-called
"hot" papers, accompanied by brief commentaries by the authors, are a regular
feature in The Scientist, the biweekly newspaper for science professionals
I founded several years ago (Garfield 1986).
Table 6. Most-cited Canadian papers, 1981�92
|
| Cites |
| 1665 |
Debold
AJ, Borenstein HB, Veress AT & Sonnenberg H. A rapid and potent natriuretic
response to intravenous injection of atrial myocardiai extract in rats.
Life Sci. 28:89-94, 1981.
Queens Univ., Kingston, Ontario
Univ. Toronto, Ontario |
| 942 |
Yanagi
V Yoshikai V Leggett K, Clark SP, Aleksander I & Mak TW. A human T-cell
specific cDNA encodes a protein having extensive homoiogy to immunoglobulin
chains. Nature 308:145-9, 1984.
Univ. Toronto, Ontario |
| 761 |
Cavenee WK, Dryja
TP, Phillips RA, Benedict WF, Godbout R, Galile BL, Murphree AL, Strong
LC & White RL. Expression of recessive alleles by chromosomal mechanisms
in retinobiastoma. Nature 305:779-84, 1983.
Univ. Utah Sch. Med., Salt Lake
City
Harvard Univ. Sch. Med., Boston,
MA
Ontario Cancer Inst., Toronto
Univ. Toronto, Ontario
Chlldrens Hosp., Los Angeles, CA
Univ. So. California Sch. Med.,
Los Angeles
Univ. Texas, Houston |
| 653 |
Poser CM, Paty
DW, Scheinberg L, McDonald WI, Davis FA, Ebers GC, Johnson KP, Sibley WA,
Siiberberg DH & Tourtellotte WW. New diagnostic criteria for multiple
sclerosis�guidelines for research protocols. Ann. Neural. 13:227-31, 1983.
Boston Univ. Sch. Med., MA
Univ. British Coiumbia, Vancouver
Yeshiva Univ. Albert Einstein Coil.
Med., Bronx, NY
Natl. Hosp., London, England
Rush Presbyterian-St. Lukes Med.
Ctr., Chicago, IL
Univ. Western Ontario, London
Univ. Maryland Sch. Med., Baltimore
Univ. Arizona Sch. Med., Tucson
Univ. Pennsylvania Sch. Med., Philadelphia
Univ. California Los Angeles Sch.
Med.
Vet. Admin. Wadsworth Med. Ctr.,
Los Angeles, CA |
| 634 |
Gauldie J, Richards
C, Harnish D, Lansdorp P & Baumann H. Interferon beta-2/B-cell stimulatory
factor type 2 shares Identity with monocyte-derived hepatocyte stimulating
factor and regulates the malor acute phase protein response in liver cells.
Proc. Natl. Acad. Sci. US 84:7251-5, 1987.
McMaster Univ., Hamilton, Ontario
British Columbia Cancer Res. Ctr., Vancouver
NY State Dept. Health, Buffalo |
| 630 |
Zuker M & Stiegier
P. Optimal computer folding of large RNA sequences using thermodynamics
and auxiliary information. Nucleic Acids Res. 9:133-48, 1981.
Natl. Res. Council Canada, Ottawa, Ontario |
| 627 |
Tversky A & Kahneman D. The framing of decisions
and the psychology of choice. Science 211:453-8, 1981.
Stanford Univ., CA
Univ. British Columbia, Vancouver |
| 599 |
Collingridge GL,
Kehl SJ & McLennan H. Excitatory amino acids In synaptic transmission
in the Schaffer collateral commissural pathway at
the rat hippocampus.
J. Physiol. London 334:33-46, 1983.
Univ. British Columbia, Vancouver |
| 559
|
Flynn TG, Debold
ML & Debold AJ. The amino acid sequence of an atrial peptide with potent
diuretic and natriuretic properties. Biach. Blaphys. Res. 117:859-65, 1983.
Queens Univ., Kingston, Ontario
Hotel Dieu Hosp., Kingston, Ontario |
| 553 |
Kimura H, McGeer PL, Peng JH & McGeer EG. The
central choilnergic system studied by choline acetyltransferase immunohistochemistry
In the cat.
J. Camp. Neural. 200:151-201, 1981.
Univ. British Columbia, Vancouver |
| 515 |
Zoller MJ &
Smith M. Oligonucleotide directed mutagenesis using M13-derived vectors�
an efficient and general procedure for the production of point mutations
In any fragment of DNA. Nucleic Acids Res. 10:6487-500, 1982.
Univ. British Columbia, Vancouver |
|
Table 7. Most-cited Canadian papers, 1981�92: physical,
chemical, engineering sciences
|
| Cites |
|
| 467 |
Jorgensen WL, Chandrasekhar J, Madura JD, Impey RW
& Klein ML. Comparison of simple potential functions for simulating
liquid water.
J. Chem. Phys. 79:926-35, 1983.
Purdue Univ., Lafayette, IN
Natl. Res. Council Canada, Ottawa,
Ontario |
| 392 |
Tarascon JM, Lepage Y, Barboux P, Bagley BG, Greene
LH, McKinnon WR, Hull GW, Giroud M & Hwang DM. Crystal substructure
and physical properties of the superconducting phase Bl4(Sr,Ca)6Cu4O16+x.
Phys. Rev. B 37:9382-9, 1988.
Belicore, Red Bank, NJ
Natl. Res. Council. Canada, Ottawa,
Ontario |
| 323 |
Kauppinen JK, Moffatt DJ, Mantsch HH & Cameron
DG. Fourier self econvolution�a method for resolving intrinsically overlapped
bands. Appi. Spectr. 35:271-6, 1981.
Natl. Res. Council Canada, Ottawa,
Ontario |
| 284 |
Brown ID & Altermatt D. Bond valence parameters
obtained from a systematic analysis of the inorganic crystal structure
database. Acta Cryst. 841:244-7,1985.
McMaster Univ., Hamilton, Ontario |
| 279 |
Vandenberg DA. Star clusters and stellar evolution.
1. improved synthetic color magnitude diagrams for the oldest clusters.
Astrophys. J. Suppl. 51:29, 1983.
Univ. Victoria, British Columbia |
| 268 |
Godfrey S & Isgur N. Mesons in a relativized
quark model with chromodynamics.
Phys. Rev. D32:189-231, 1985.
Univ. Toronto, Ontario |
| 259 |
Stetson PB. DAOPHOT�a computer program for crowded
field stellar photometry. Pubi. Astronom. Soc. Japan 99:191-222, 1987.
Herzberg Inst. Astrophys., Victoria,
British Columbia |
| 251 |
Moore BC. Principal component analysis in linear systems�controllability,
observability, and model reduction. IEEE Trans. Auto.
Control 26:17-32, 1981.
Univ. Toronto, Ontario |
|
Table 8 identifies the ten "hottest" Canadian papers published
since January 1990. The first column of data shows the number of citations
each paper received in the two-month period January�February 1993. The
second column shows total citations from publication through February 1993.
The first three papers all include authors from the University of Toronto.
In fact, the University of Toronto appears on seven of the ten hottest
Canadian papers. The second paper on the list is interesting to note. A
1991 Nature paper by H.H.M. Vantol and colleagues, it concerns genetic
cloning for a humati dopamine receptor. Another paper published in the
same issue of Nature by essentially the same team of authors also
appears on the list.
Mapping science by co-citation analysis
The difficulty of classifying papers by journal
groups was illustrated earlier. To overcotne the arbitrariness of all manual
classification systems, we long ago began using co-citation analysis to
create a dynamic systetn for classifyitig papers. Co-citation analysis
enables us to literally map the structure of research specialties and fields.
These structural relationships emerge when co-citation analysis and multidimensional
scaling methods are applied to our database (Small 1973;
Small
and Garfield 1985).
Table 8. The 10 "hottest" Canadian papers,
1991�93
(published since January 1990 and cited in January/February
1993)
|
| Jan/Feb Cites |
Total Cites |
|
|
| 57 |
273 |
Koch CA, Anderson D, Moran
MF, Ellis C & Pawson T. SH2 and SH3 domains� elements that control
interactions of cytopiasmic signaling proteins.
Science 252:668-74, 1991.
Univ. Toronto, Ontario |
| 34 |
195 |
Vantol HHM, Bunzow JR, Guan
HC, Sunahara RK, Seaman P, Niznik HB & Civelli O.
Cloning of the gene for a human dopamine D4 receptor
with high affinity for the
antipsychotic clozapine. Nature 350:610-14,
1991.
Univ. Toronto, Ontario
Oregon Health Sci. Univ., Portland
Clarke Inst. Psychiatry, Toronto,
Ontario |
| 30 |
50 |
Stangeby PC & McCracken
GM. Plasma boundary phenomena in tokamaks.
Nuclear Fusion 30:1225-379, 1990.
Univ. Toronto, Ontario
Jet Joint Undertaking, Abingdon,
Oxon, England
UKAEA, Abingdon, Oxon, England |
| 28 |
272 |
Yangyen HF, Chambard JC, Sun
YL, Smeal T, Schmidt TJ, Drouin J & Karin M.
Transcriptional interference between c-jun and the
glucocorticoid receptor-mutual
inhibition of DNA binding due to direct protein-protein
Interaction.
Cell 62:1205-15, 1990.
Univ. California San Diego Sch.
Med., La Jolla
Inst. Recherche Clin. Montreal,
Quebec
Univ. Iowa, Iowa City |
| 28 |
256 |
Call KM, Giaser T, Ito CY,
Buckler AJ, Peiletier J, Haber DA, Rose EA, Kral A,
Yeger H, Lewis WH, Jones C & Housman DE. isolation
and characterization of a zinc
finger polypeptide gene at the human chromosome 11
Wilms tumor locus.
Cell 60:509-20, 1990.
Massachusetts Inst. Tech., Cambridge
Harvard Univ. Sch. Med., Boston,
MA
Hosp. Sick Children, Toronto, Ontario
Univ. Toronto, Ontario
Eleanor Roosevelt Inst. Cancer
Res., Denver, CO
Univ. Colorado Health Sci. Ctr.,
Denver |
| 28 |
107 |
Hope BT, Michael GJ, Knigge
KM & Vincent SR. Neuronal NADPH diaphorase is a
nitric oxide synthase. Proc. Natl. Acad. Sci. US 88:2811-14,
1991.
Univ. British Columbia, Vancouver
Univ. Rochester Sch. Med., NY |
| 27 |
298 |
Cohen P, Holmes CFB & Tsukitani
Y. Okadoic acid�a new probe for the study of cellular regulation. Trends
Biochem. Sci. 15:98-1 02, 1990.
Univ. Dundee, Scotland
Fulisawa Chem. Co., Tokyo, Japan
Natl. Res. Council Canada, Montreal,
Quebec |
| 25 |
182 |
Isgur N & Wise MB. Weak
Interaction form factors between heavy mesons.
Phys. Left. B. 237:527-30, 1990.
Univ. Toronto, Ontario
California Inst. Tech., Pasadena |
| 22 |
262 |
Lane DP & Benchimol S.
P53�oncogene or anti-oncogene?
Genes & Development 4:1-8, 1990.
Imperial Cancer Res. Fund, Potters
Bar, Herts, England
Univ. Toronto, Ontario |
| 22 |
147 |
Sunahara RK, Guan HC, O�Dowd
BF, Seeman P, Laurier LG, Ng G, George SR,
Torchia J, Vantol HHM & Nlznlk HB. Cloning of
the gene for a human dopamine D5
receptor with higher affinity for dopamine than Dl.
Nature
350:614-9, 1991.
Univ. Toronto, Ontario
Addiction Res. Fdn., Toronto, Ontario
Clarke Inst. Psychiatry, Toronto,
Ontario |
|
Explained simply, co-citation analysis involves tracking pairs
of papers that are cited together in the source articles we index. With
single-link clustering techniques, a cluster of research begins to form
when the same pairs of papers are co-cited with many others. The co-cited
papers in these clusters usually share some common thread. Indeed, papers
at the "core" of these clusters turn out to be the foundation or key publications
of a particular research specialty. They are highly cited by researchers
currently working at the forefront of the specialty.
Figures 10�15 demonstrate this research front mapping capability of
ISI�s new SciMap system. This special file includes all ISI-indexed papers
published from 1989 through 1991 that were cited at least ten times. In
effect, this current file identifies "hot" research front specialties.
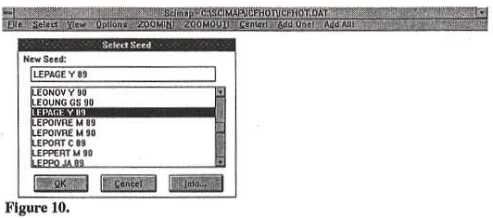
Figure 10 shows a typical opening screen on the SciMap system. The SciMap
system can be searched by author, address, journal, or title words. In
this example, we start our mapping exercise by using the author dictionary.
We�ve selected Y. LePage, a Canadian author working on superconductivity
who was identified earlier in the list of most-cited physics and chemistry
papers. By selecting the "OK" option from the menu of choices at the bottom
of the box, the SciMap system plots this paper as the starting point of
the cluster.
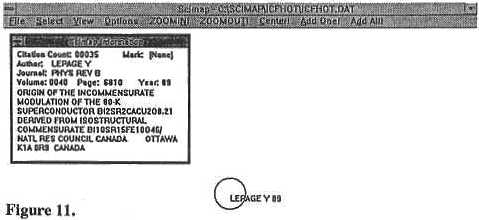
As Figure 11 illustrates, the SciMap program provides a bibliographic
reference for the paper in the information box at the left�first author,
journal, volume, starting page, year, paper title, and author address.
In addition, the number of 1989�91 citations is provided on the top line.
The SciMap program also plots the LePage paper as a hollow circle and
provides an identifying label. At this point, we simply select the "ADD
ONE" option from the menu at the top of the screen to see what other paper
is linked to the LePage paper by co-citation.
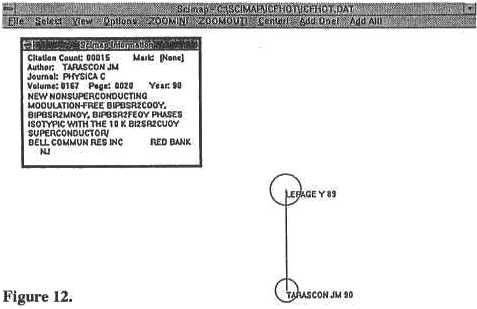
Figure 12 shows that the computer has retrieved the second paper in
this growing cluster, a 1990 Physica C paper by J.M. Tarascon, Bell
Communications Research Laboratories, Red Bank, New Jersey, and colleagues.
As it turns out, LePage is a co-author of this paper. The paper received
fifteen citations, of which nine also cited the LePage paper. The distatice
between the circles reflects the co-citation "strength" of association
between these papers. And the size of the circles reflects their relative
citation frequency.
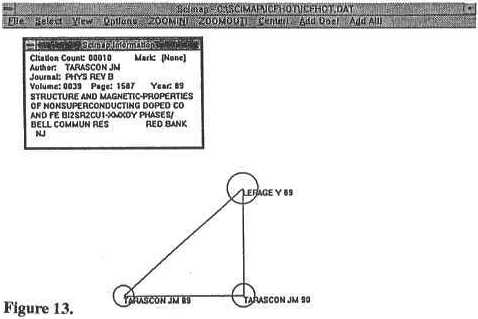
The next item added to the cluster is another paper by Tarascon with
LePage as a co-author, shown in Figure 13. Published in the 1989 Physical
Review B, it was cited ten times. It was co-cited with the LePage paper
eight times, and co-cited five times with the first Tarascon paper.
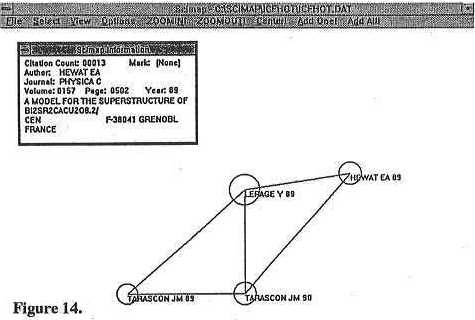
In Figure 14, we see that the next item added to the cluster is a 1989
Physica
C paper by E.A. Hewat, Centre for Nuclear Studies, Grenoble, France.
It was cited thirteen times; in eleven instances the LePage paper was co-cited,
and in four the 1990 Tarascon paper was co-cited.
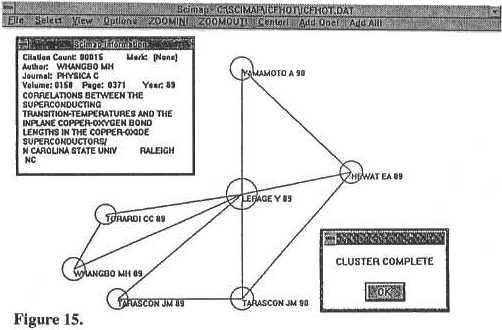
We can continue to add new papers until the cluster is completed, as
is shown in Figure 15. The SciMap program indicates that the cluster
is complete now. That is, no other papers are linked with it by co-citation
at the specified strength threshold. The last to be added was a 1989 Physica
C paper by M.H. Whangbo, North Carolina State University, Raleigh,
and colleagues.
In effect, the SciMap program has identified seven papers concerning
various structural, magnetic, and other properties of superconducting materials.
As stated previously, these papers can be considered the "core" or foundation
papers on this topic. Of course, these are not the only papers relevant
to superconductivity. Our database includes many other clusters related
to the structural and magnetic properties of superconductors. But these
papers are most closely associated with the original "seed" paper by LePage.
Conclusion
This concludes our presentation on what citation data can tell us about
a nation�s scientific performance. The examples we�ve reviewed are intended
to illustrate the range of perspectives that citation-based indicators
can provide. Tracking trends in output and impact, identifying the highest
impact papers or institutions or authors, and mapping the core publications
on a given topic by co-citation analysis each provide a unique view on
different aspects of Canadian science.
While citation data create new tools for analyses of research performance,
it should be stressed that they supplement rather than replace other quantitative�and
qualitative�indicators. And like other indicators, the appropriate and
balanced interpretation of citation data requires the input of information
specialists working with knowledgeable scientists.
Note All illustrations © Institute for Scientific Information.
References
back to textGarfield,
Eugene. 1977 (January 3). Introducing
Citation Classics: The human side of scientific reports. Current
Contents no.1: 5-6. Reprinted in Eugene Garfield, Essays
of an information scientist, Vol.3, 1�2 (Philadelphia: ISI Press, 1980).
back to textGarfield,
Eugene. 1983a. Citation
indexing: Its theory and application in science, technology, and humanities.
Philadelphia: ISI Press. 274p.
back to textGarfield,
Eugene. 1983b. How
to use citation analysis for faculty evaluations, and when is it relevant.
Part 1�Current Contents no.44 (October 31): 5�13;
Part 2�Current Contents no.45 (November 7): 5�14. Reprinted
in Eugene Garfield, Essays of an information scientist, Vol.6, 354�72
(Philadelphia: ISI Press, 1984).
back to textGarfield,
Eugene. 1986 (July 21). Introducing
The
Scientist: At last, a newspaper for the science professional.Current
Contents no.29: 3�6. Reprinted in Eugene Garfield, Essays of an
information scientist: Towards scientography, Vol.9,222�25 (Philadelphia:
ISI Press, 1988).
back to textGarfield,
Eugene. 1990 (January 22). Announcing
Science Watch: A unique newsletter that tracks trends and performance
in scientific research.Current Contents no.4: 3�6. Reprinted
in Eugene Garfield, Essays of an information scientist: Journalology,
Key-Words Plus, and other essays, Vol.13, 25�28 (Philadelphia: ISI
Press, 1991).
back to textGarfield,
Eugene, and Alfred Welljams-Dorof. 1992.
Citation data: Their use as quantitative indicators for science and technology
evaluation and policy-making. Science and Public Policy 19:
321�27.
pdf file
back to textSmall,
Henry. 1973. Co-citation in the scientific literature: A new measure of
the relationship between two documents. Journal of the American Society
for Information Science 24: 265�69.
back to textSmall,
Henry, and Eugene Garfield. 1985. The
geography of science: Disciplinary and national mappings. Journal
of Information Science 11: 147�59.